
Markets have sneezed, what next?
Keep calm and invest on

I have been away from looking at the markets since the 24th of July1. I had an impending vacation and I was expecting some intensity at work upon return - seemed like an apt time to take a break. I have largely totally switched off2 and enjoyed the most of what the European summer has to offer, for the good part of the last 2 weeks.

(💡: Prague and Salzburg are way underrated, for different reasons. I went to both places for the second time in my life and I can’t believe how privileged I am to witness such great locations. The above view is from Untersberg peak, close by to Salzburg.)
As I return to take stock, the past two weeks have offered much opportunity for investors to sweat and panic, though it is not clear to me why. The markets (referenced by S&P 5003) hit an all time high on 16th July and have since been drifting down. As I draft this post, the markets are down about 6.14% from their all time peak. In general, in market-speak, a correction is a 10% drawdown and a crash is 20% - we are nowhere close to anything dramatic yet. I would like to use the much softer phrase “markets have sneezed” to describe where we find ourselves. We still don’t even know if it is a cold, an allergy or something more serious.
Some perspective
Let’s look at some data visually. S&P spends a lot of time being under its all time high. Here is the drawdown chart of data from S&P 500 from 2000 to date. To recap, this chart tracks where S&P is as a proportion to its previous all time high. 100% means the S&P is at a current all-time high and anything under it means it is in “drawdown”.
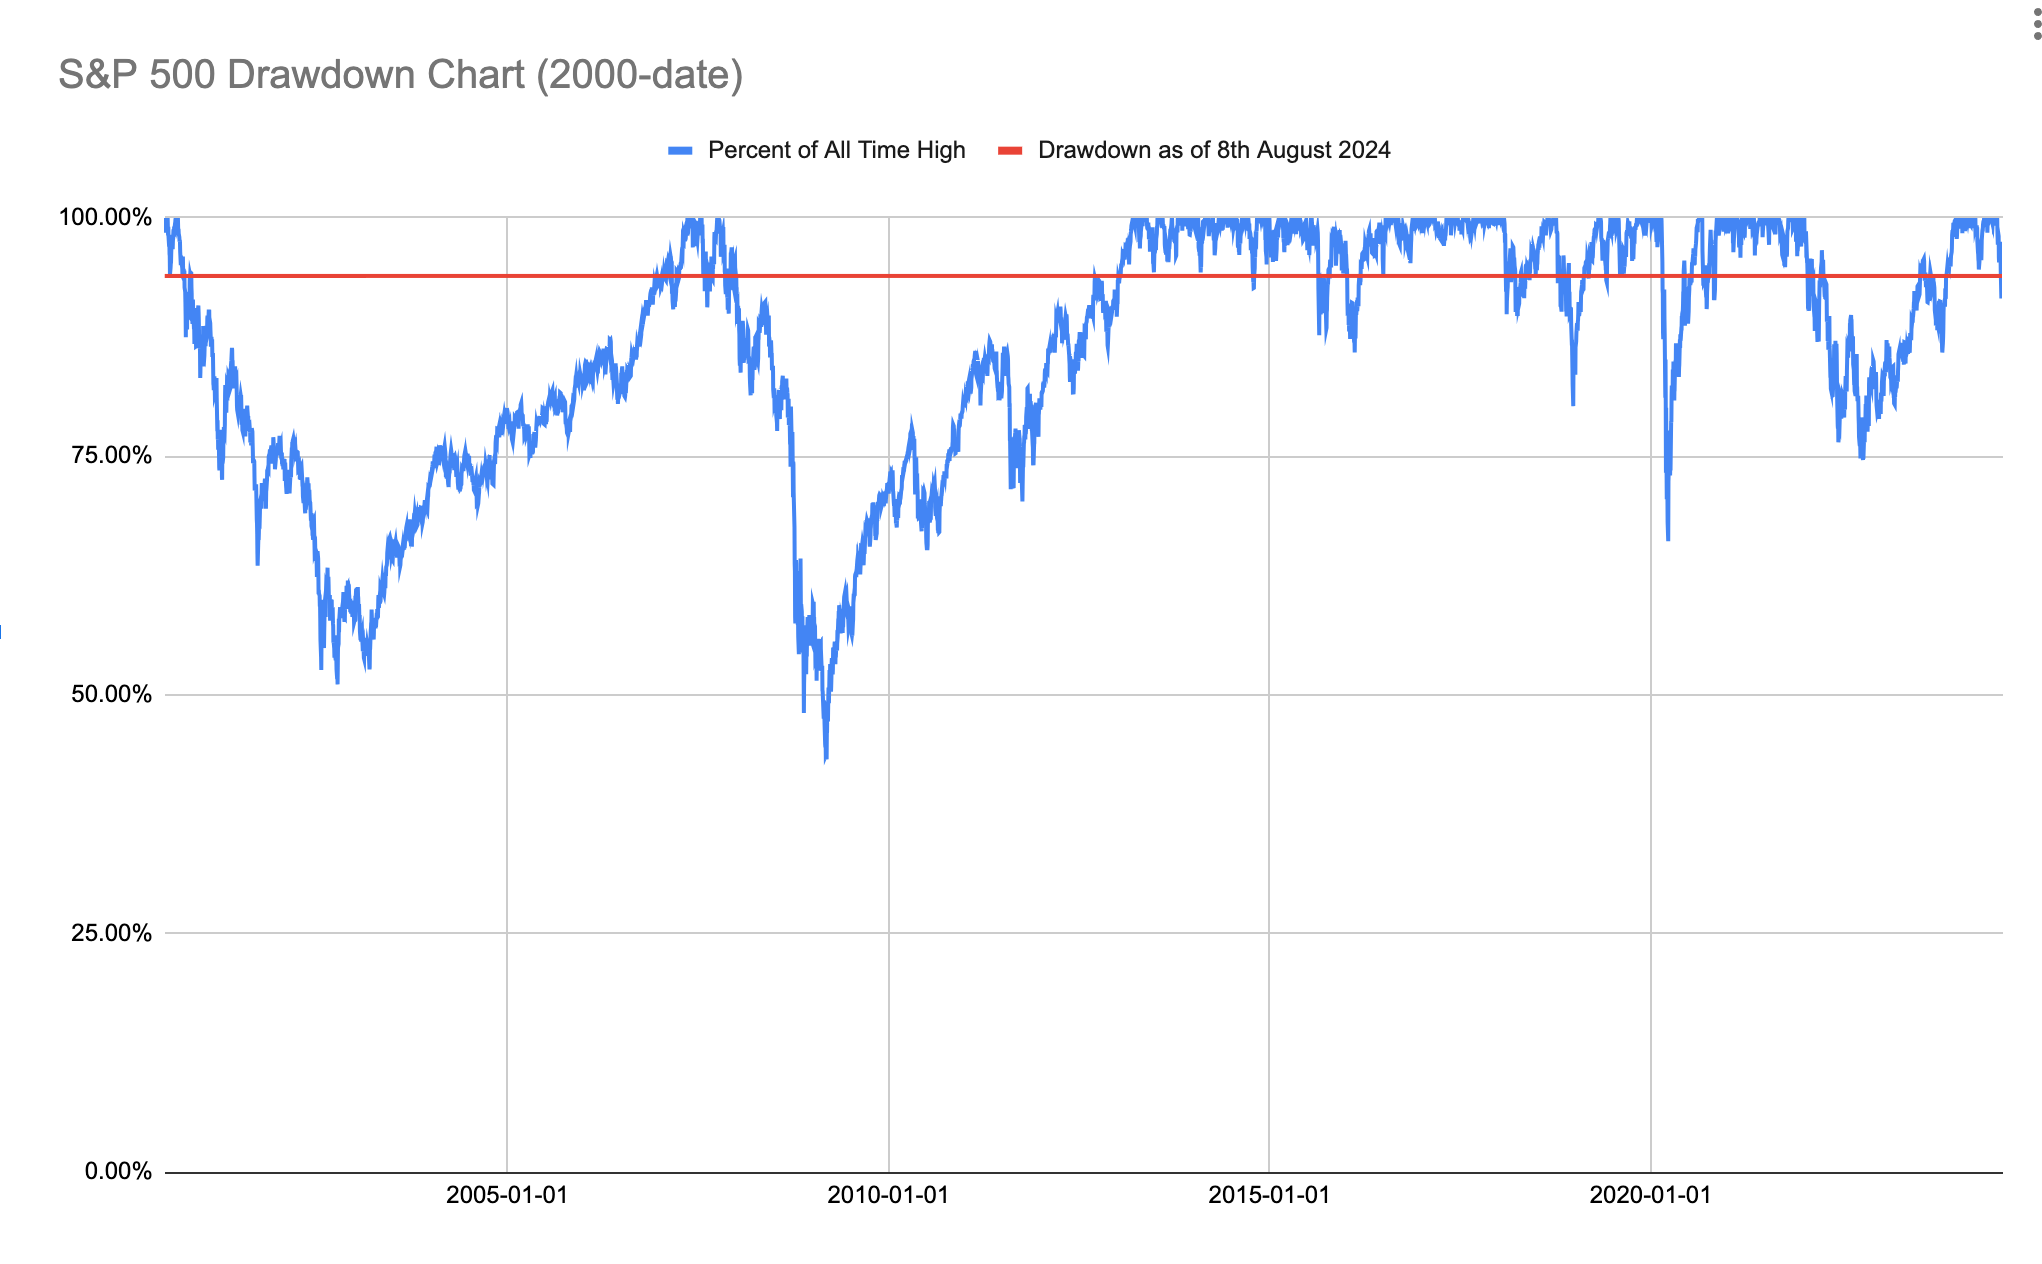
I have also drawn a red line to indicate where we are currently after the recent market sneezes. As you can see, we are nowhere near anything resembling a market downturn yet. Zooming back a bit, over long periods of time, the market is mostly in drawdown - since 2000, the markets were below its all time high 5,861 days of the 6,289 days in consideration or about 93.2% of the time, to be precise. But what about being in a drawdown greater than 6.14% drawdown we find ourselves in today? That’s about 3,769 of the 6,269 days in consideration or about 60% of the time.
Let’s recap this, on a historical basis, this drawdown isn’t significant, with the market being at a greater drawdown than this for about 60% of the time since the turn of the century. And yet, the same market has returned 7.64%4 (4.96% on inflation adjusted terms) on a total return, CAGR basis in the intervening period. Volatility is a small price to pay for the returns an investor enjoys.
Why this much reaction?
In recent months, we have been in the positive feedback territory (or near the top) of the fear and greed cycle of the market (between say steps 3 & 4 & 5 now)

This is normal and natural. In fact this cycle is what causes volatility in the market in the first place. The correction is always preceded by peak optimism and the upswing is always preceded by peak pessimism (with local maxima and local minima having localised peak optimism and pessimism).
There are of course concerns around an oncoming recession in the US and possible general slowdown in many parts of the global economy. That’s fine too. Economic cycles, like market cycles, are normal and natural. In a typical investing career, lasting about 60 years or so, you are likely to see multiple economic cycles. This doesn’t mean your portfolio will be permanently impaired5.
Furthermore, the peak pessimism and optimism in the market price of stocks correlates only weakly with the prospects of the underlying businesses in any portfolio. i.e. a business compounding its profits historically, pending an idiosyncratic event, will likely compound its profits in the future too, though there is no guarantee that it will do so next year or the year following that. However the market is deeply driven by what it expects to happen in the next quarter or at best a year.
Where will the market be in the future?
No one knows. If anyone tells you they know where the market will be with any level of certainty, run away, as fast as you can. However, let me suggest a couple of mental frameworks to think about markets.
In the next month, where the market will be is like guessing where a coin toss will land - roughly 50-50 odds.
In the next 5 years, where the market will likely be is a bit like throwing a dice and expecting between 2 & 6. Your odds are very high but not yet 100%.
In the next 22 years (when I hit 65), where the market will be is a bit like throwing a dice 100 times and expecting a score greater than 100. Odds are very very high that the market will be (a lot) higher than where we are today.6
What should I do as an investor?
If you are truly an “investor” - i.e. investing for the long run, and if your portfolio is constructed with reasonable amount of thought and diversification, you shouldn’t be worried. Take a look at your portfolio, review the business prospects of what you own, and the current valuation. Unless you see something egregiously out of bands, you are perhaps better off leaving your investments alone.
Should I buy more?
Remember that regular investing beats drawdowns handsomely. If you are already doing regular investing, your should probably just let it continue. If you have excess left around that you don’t need for foreseeable future (3-5 years), then yes, adding to your position always makes sense, but do so in small chunks.
Should I sell now?
That depends - do you need the money imminently? Do you think your portfolios are overvalued? Would you regret selling if the market shoots up 10% overnight? Selling is always an option but one should do so only after careful consideration and even then you are better off doing it in small chunks. If you are done with the accumulation part of your life and in financial independence phase, then a regular decumulation is perhaps most advisable than outright selling.
More to read
If you are still anxious and would rather spend your time on my blog than reading mainstream financial news (always an excellent idea if I may be allowed to say so myself), then here are some posts from the past that might prove timely.

With that note, happy investing!

Disclaimer: What’s mentioned in this post is strictly for educational and entertainment purposes only. I am not your financial advisor and bear no fiduciary responsibility for your actions. Do your own due diligence, or consult a financial advisor before investing in any securities or planning your retirement.
I have small amounts of my capital in trading and I suffered substantial losses in trading on 24th July which prompted my withdrawal. Thankfully that’s (a) a small part of my capital and (b) has 0 overlap with my coffee can portfolio. That portfolio has also come down in recent mark turmoils, but I am not worried in the least bit.
I knew something was happening through social media sources.
Other markets have gone down more but the principles of thinking about this should be the same, at least IMHO.
These returns are lower than returns in most other periods, due to effects of the 1999/2000 bubble that was still underway where the time series started. for intellectual honesty purposes, I am keeping it as is. The argument is not watered down though.
In rare circumstances it can be impaired, like the Japanese found out after their peak in 1990s. We haven’t had a permanent impairment like that in world markets taken as a whole. That’s not to say it can’t happen. We are all servants to probabilities here.
I am aware that this is not a scientific treatise of the matter. For more interesting data based analysis on the market movements, my previous post.