
Analysis of S&P 500 price movements
Some interesting stats

Recently I have been poring through S&P 500 data from the beginning of century as a academic exercise - to see if I could spot trends I could benefit from. I didn’t find anything that was out of expected, but I found a lot of interesting tidbits that I am sharing today in this post.
About the data
The analysis is based on closing prices of S&P 500 from 3rd Jan 2000 to 12th July 2024, collected through Google Sheets’s GoogleFinance function. Spot checks tell me that it is an accurate source of data. With about 6269 closing prices, and about 25 derivative columns, the data used comprises of over ~100K data points. Since this is looking at pure index data, dividends are ignored. For cases where long term metrics are concerned, users are advised to factor in dividends into any mental notes they make.
Daily Movements
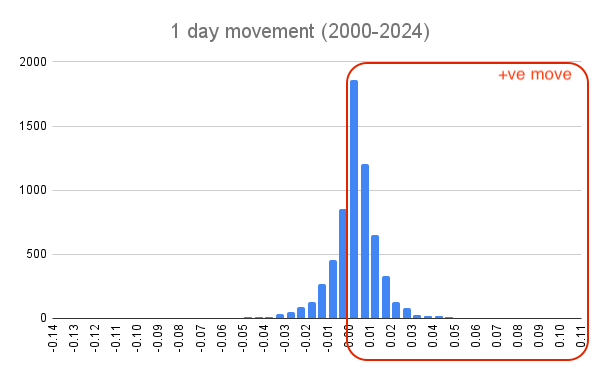
Let’s start with the unsurprising bits. Vast majority of the days, the index moves very little, between -0.15% to about 0.15%, with the median being 0.03%. The graph is heavier on the right side of the 0 line than it is on the left side and this makes total sense - after all the index mostly goes up - even though the index spends a lot of days declining, it spends more days advancing.
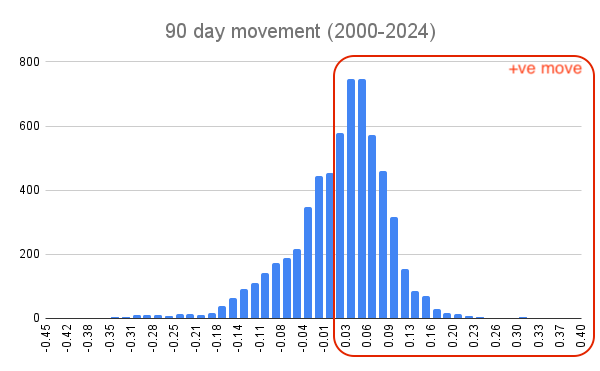
Let’s zoom out a little. Across 90 day periods, the graph is favouring being the positive significantly. The median return is 2.92%.
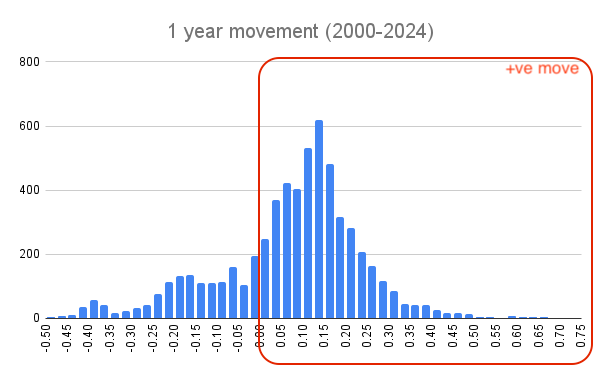
Let’s zoom out further and look at 1 year returns of the index. Vast majority of the returns are now positive, with the median being 10.21%.
Take 2 years of returns and the left hand side is further diminished. The median returns are 17.66%.
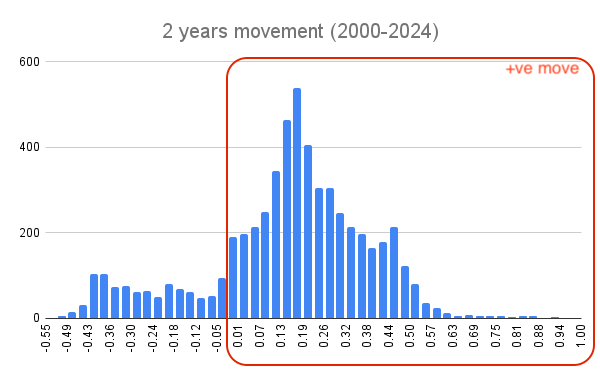
If you extend it all the way to 5 years, the returns tend to be even more positive (with a median 5 year IRR of 8.84%), however, you could be stuck with negative returns even if you hold it for 5 year periods, depending on when you enter the market.
To summarise this section, the index moves around a lot on a daily returns basis, but it tends to ever so slightly move up. The longer term you look, the more positive are the spread of returns. However, tail risks exist. You could hold the index for 2 years and still be down a half - that happened on 9th March 2009, right at the bottom of the GFC downturn.
Winning and Losing Streaks
A winning streak is when the index continues to go up for multiple days in a row. Conversely, a losing streak is when the index declines for multiple days in a row. Returns associated with streaks follow a similar bell curve of returns.
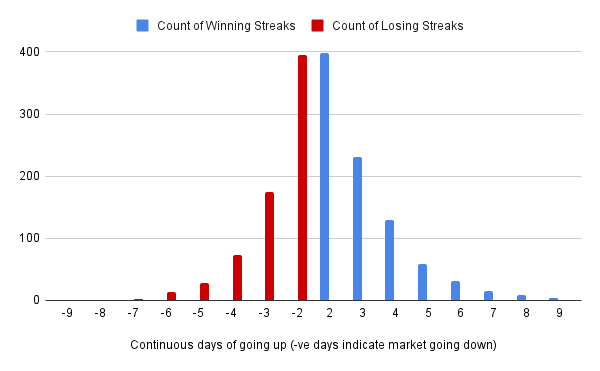
Again, we see that the index spends longer streaks more often winning than losing. However, I was surprised that the longest streaks in either directions is just shy of two trading weeks. So, if the index goes up 7-9 days, you can kind of sort of1 expect it to go down the following day and vice versa. This could come in as a handy tactic.
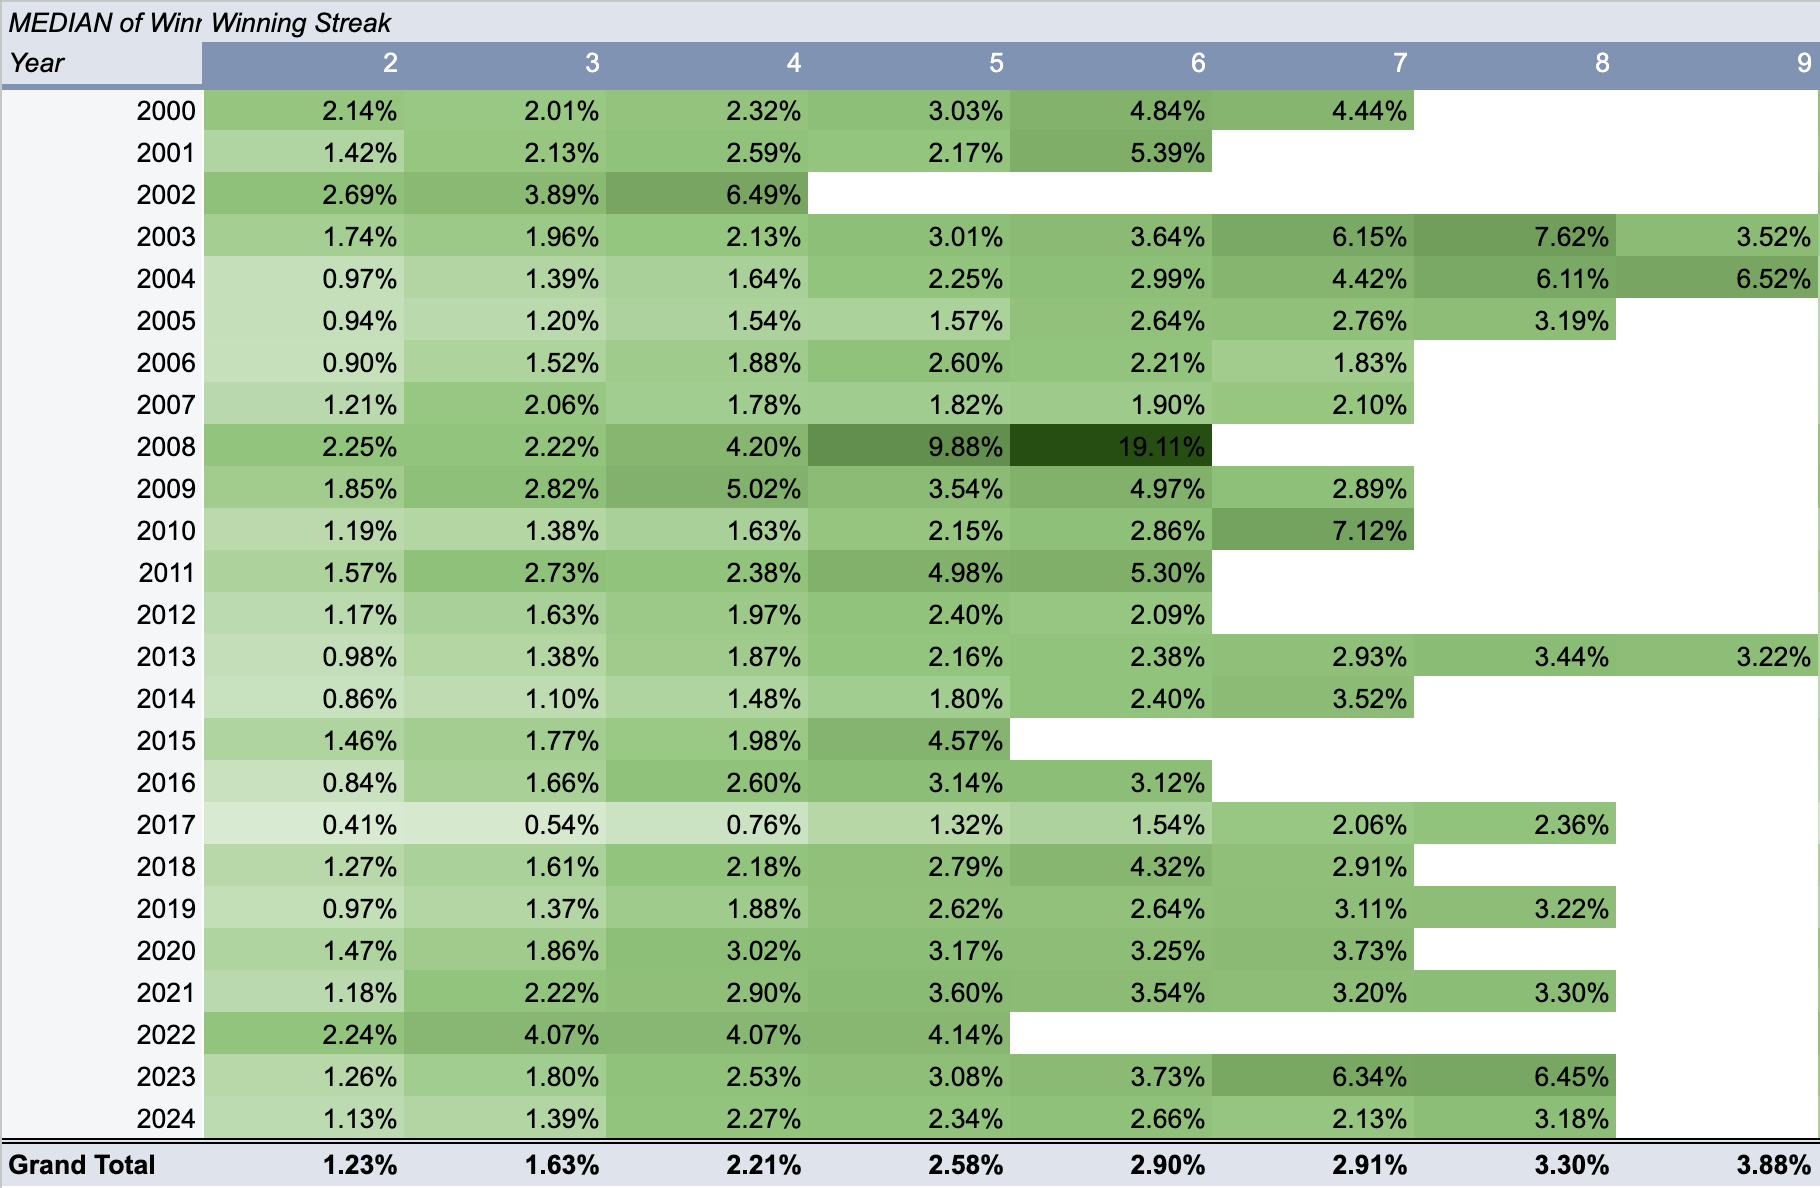
Let’s now turn our heads to the median returns during streaks. Very intuitively longer the streak higher the returns, with very few inversions (like in 2003, where the 9 day streak produced lower median returns than the 7 day or the 8 day streaks). What’s interesting is that very long winning streaks are not a given - there are 3 years with a maximum of only 5 day winning streaks. 9 day winning streaks are extremely rare.
Very similar trends for losing streaks too - longer the streak, the worse the median returns from the streak.
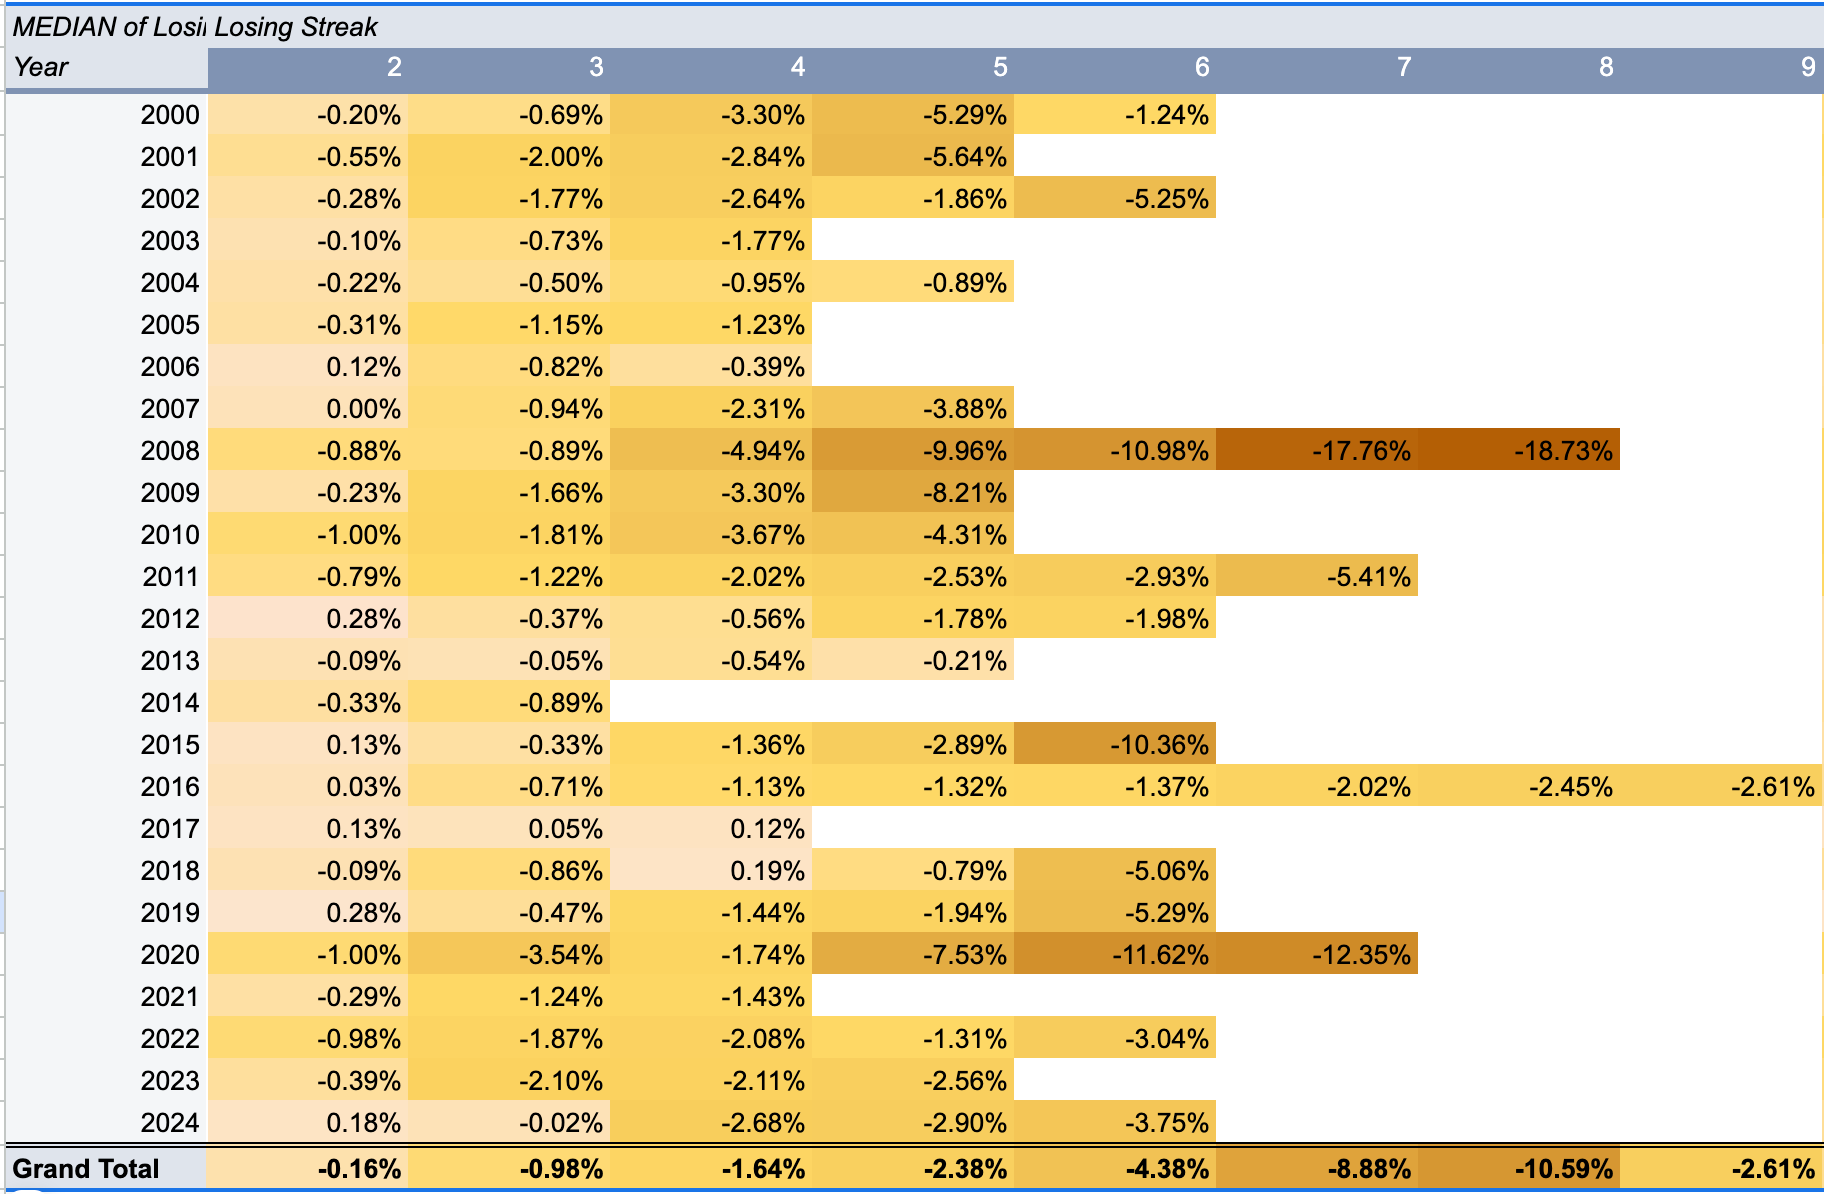
However, the length of losing streaks are decidedly shorter than the winning streaks. Very long losing streaks (longer than 5 trading days) open happen in half the years.
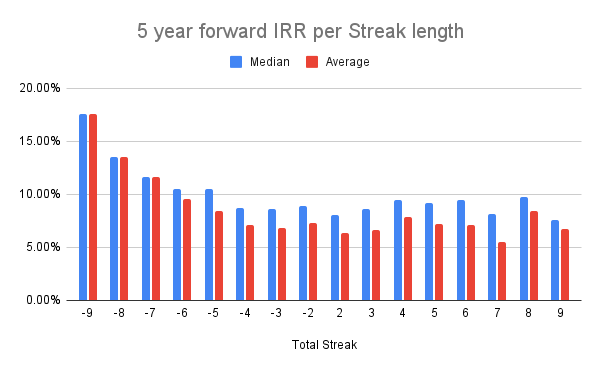
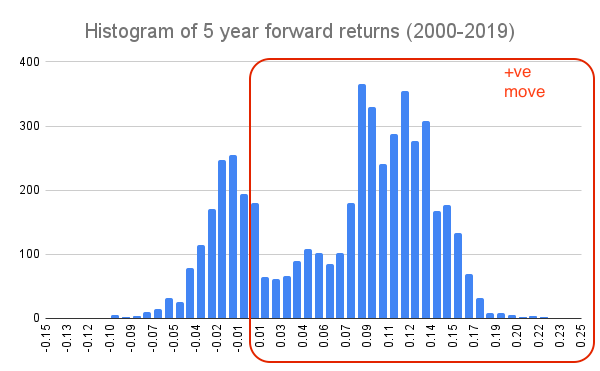
One more thing about streaks. I tried to analyse the 5 year forward return of the index at the end of each streak, imagining that there might be a secular pattern. While I didn’t find any discernible pattern on the winning streak side, it is clear that forward returns tend to be greater when the index is nearing its longest losing streaks. If you are looking for the perfect time to enter the markets, it might be at the end of long losing streaks (5 or more days) - there have been 45 such instances since the turn of the century. However, that’s no guarantee to a positive return too, as 6 of those 45 occasions resulted in a net negative return 5 years on. Talk about market timing being difficult!
Volatility
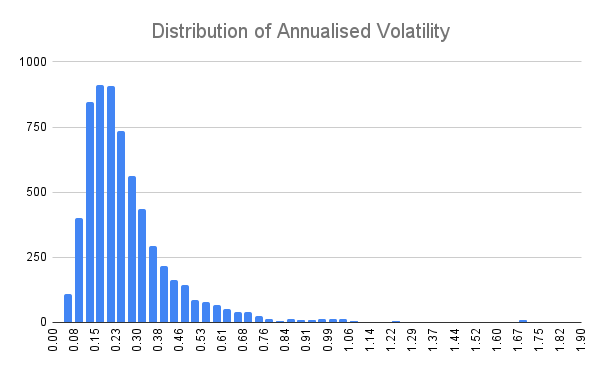
Volatility of the index has a median of 22.56% and follows an expected distribution - mostly being range-bound with a long tail.
Somewhat interestingly, the length of the winning streaks doesn’t affect volatility that much, but as the losing streak gets longer, volatility tends to spike up, a lot. This makes intuitive sense, the reason for long losing streaks is likely extreme fear, which should correlate with high levels of volatility.
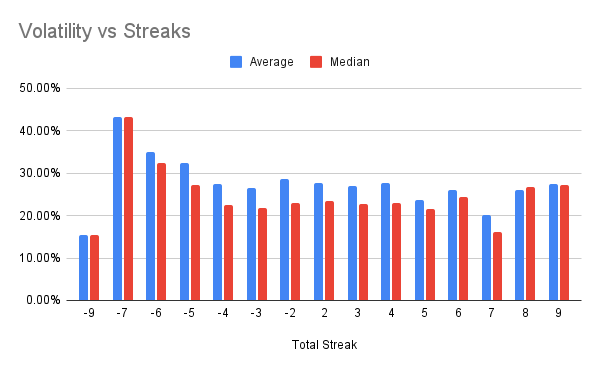
Incidentally, the current at-the-market options expiring a year out at priced at an implied volatility of ~18% - 22%, indicating that the market expects the next 12 months to look more like a median year.
Peak to Trough Spreads
The index moves around a lot. In most years, the index goes up and down, creating a fairly wide spread between the top and the bottom. Here is this spread on a year by year basis since the turn of the century.
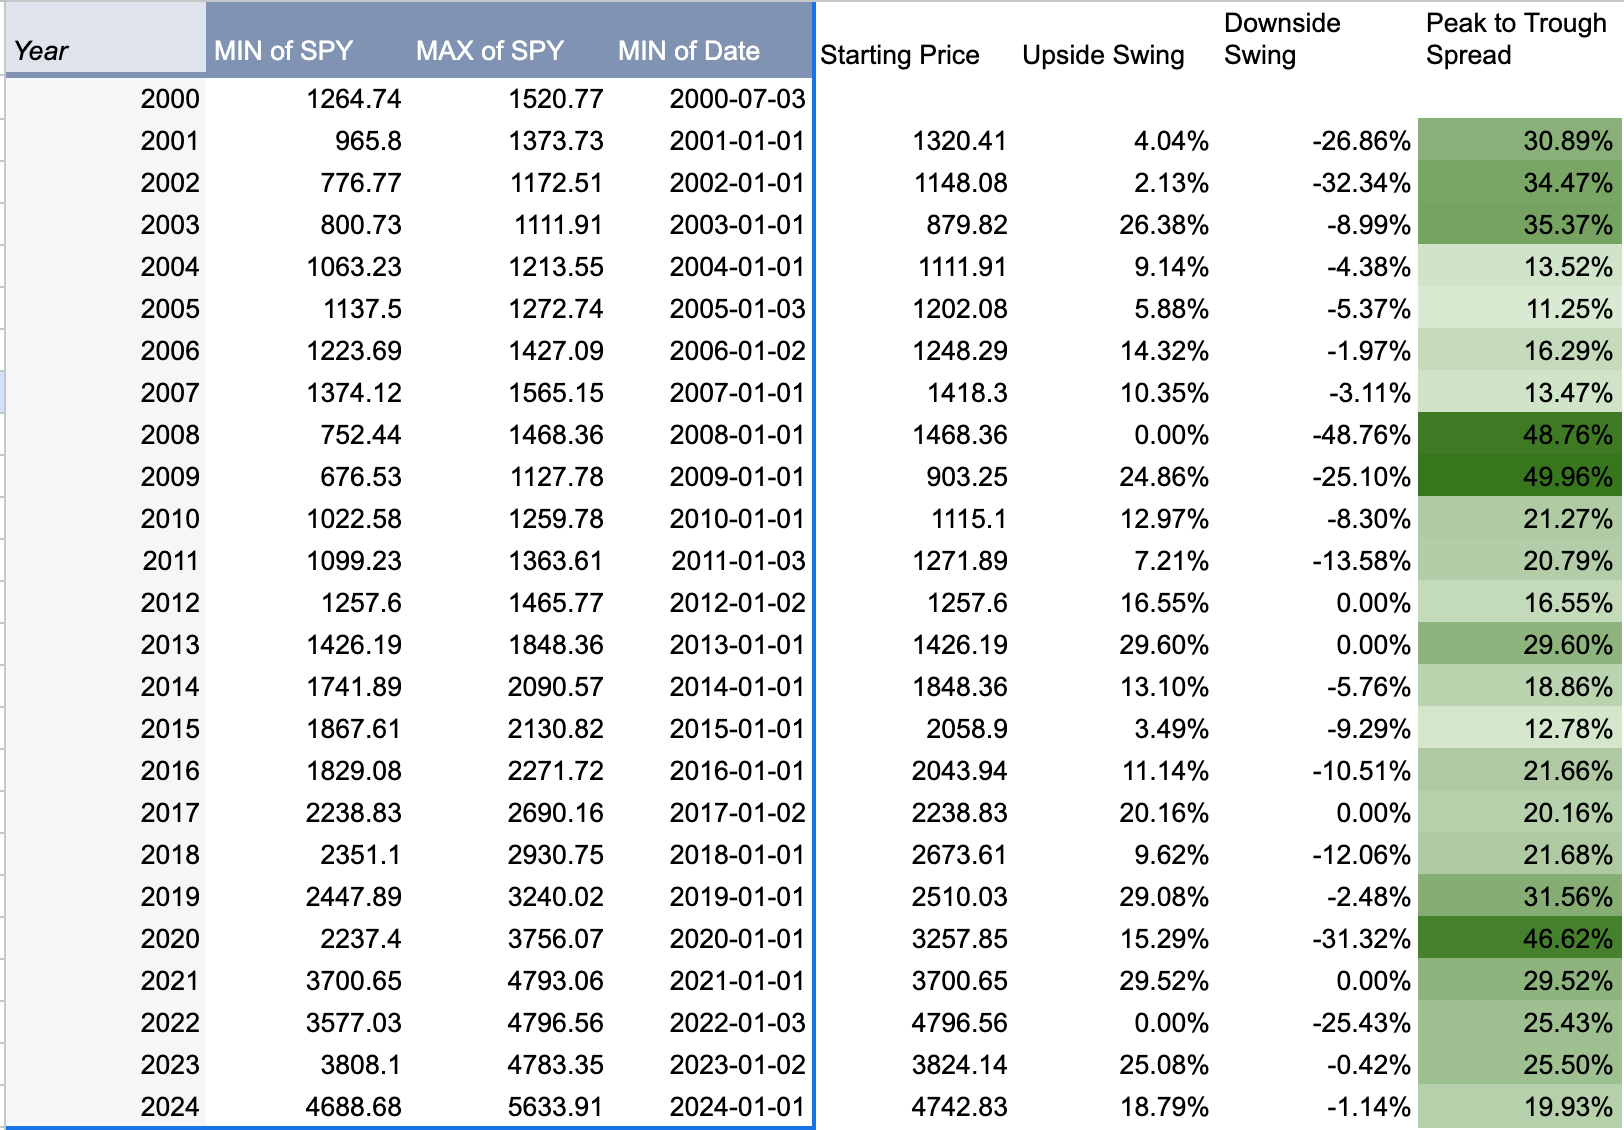
It has moved a minimum of 11% and a maximum of ~50% intra-year. More importantly, it moves a median of 22% in any given year. (2024 results aren’t complete yet for obvious reasons). If you can find a way to trade this massive movement in the index each year, you can make good money.
Summary
The beast that the index is, has its own ways of moving around. This post is meant to provide some ways to understand the movements. Taming it and making money off of this data is exceptionally hard, as well all know. Perhaps the simplest things we long term investors can do is to buy regularly and hold.
With that sobering thought, Happy Investing!
Disclaimer: I am not your financial advisor and bear no fiduciary responsibility. This post is only for educational and entertainment purposes. Do your own due diligence before investing in any securities.
These are based on relatively short window of history - just 2 years. The extremes of the index are perhaps much wider and hence one shouldn’t take these trends as the gospel. In any case, records are set to be broken. If you wish to trade, you don’t want to be caught at the wrong end when new records are set.