
Regular investing beats drawdown risks
A simple way to beat the volatility of the markets

Two weeks back, I wrote about how drawdown is a more useful measure of risk and why it plays psychological games with our long term investment interests. Today I want to follow up with some thoughts on what’s the best way to deal with drawdowns.
To recap, I am inserting the drawdown chart of Vanguard FTSE Global All Cap Index Fund (Vanguard FGACIF) in GBP.
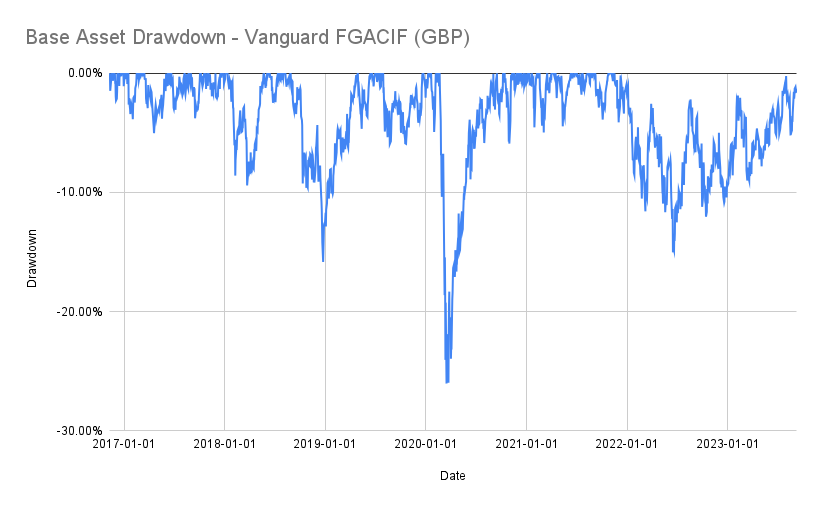
This graph, when reflected in numbers, talks about an index fund that has been 90% of the time in some form of drawdown, 30% of the time in drawdowns of > 5%, ~7% of the time in drawdowns of > 10% and even 0.81% of the time in drawdowns of > 25%. So drawdowns are a rather common state of affairs.
How best to deal with it?
For most investors the problem can be solved by Systematic Investment Plans (SIPs) or “Regular Savings Plans (RSPs)”. What’s an SIP or RSP? Simply put, it is the process of investing a regular amount of money every single month. This is also called Dollar Cost Averaging (DCA) in some markets.
Given that the price of investments we wish to acquire go up and down, it is natural that buying a little bit every month tends to average the price out across these minor volatilities in the market. Given that most of us invest in the markets through savings from our regular incomes (read paycheck), it is but natural that our investing cycles naturally fit the needs of a typical SIP/RSP/DCA cycle.
Circling back on Drawdowns
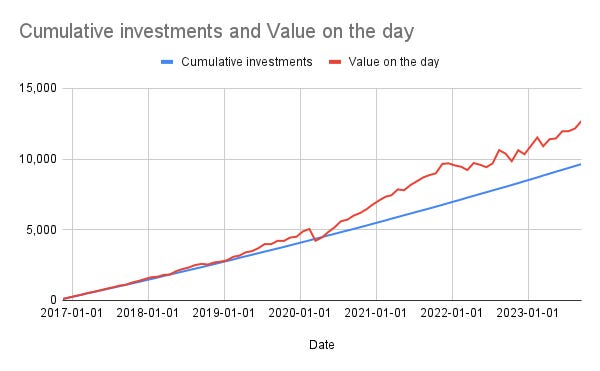
Does SIP/RSP/DCA in fact deals with drawdowns in a way that’s beneficial for us? Surprisingly, yes. I simulated the data, where every month £100 is invested in the same fund (Vanguard FGACIF). I also apply a simple rule that every 12 months, the investment amount is increased by 5%. In the second year, for instance, the investment becomes £105 per month, £110.25 per month in the third year and so on.
In doing so, and starting on 2016-11-15 (a week after the fund was launched) and investing each 15th of the month, I could simulate what happens to our investments, returns and most importantly drawdowns.
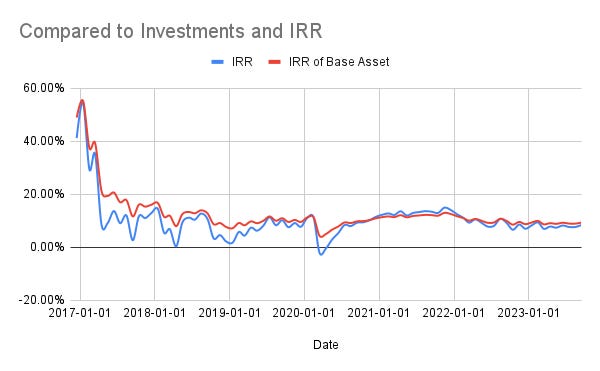
Results: Returns
At first glance, returns are very very similar. Remember that the fund we buy largely traded above £100 since its inception and so, you are buying almost all your invested amounts at prices of greater than £100 and you would assume that this would reduce your returns. It trades at £180+ today. Returns of investments made at £100 should be greater than those made at £110 for instance. However, if the £110 investment was made 2 years later, and the fund itself averaged a return of 6% over its lifetime (as an example), then your investment at £110 2 years later is in fact better than the £100 investment on the original date. So, buying at higher prices, and the effect of time, cancel each other out.
Put together, returns are easily comparable between a lump sum investment at the launch of the fund vs investing on a regular basis.
The cumulative investments through the regular investment method hardly ever go underwater, despite the fact that the underlying asset was in drawdown for 90%+ of the time. In fact the only time it went underwater was when the underlying asset tanked down as a result of the early pandemic lockdowns, and the fund itself was in a drawdown > 25%, its own worst performance to date.
Results: Drawdowns
What happens to drawdowns when we invest through a regular investment methodology? It significantly improves.
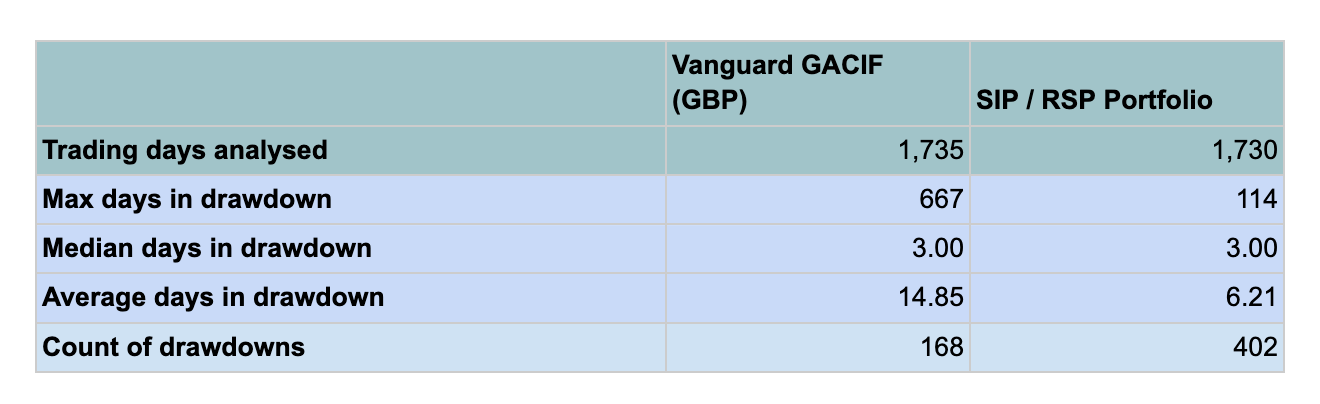
Look at the data below:
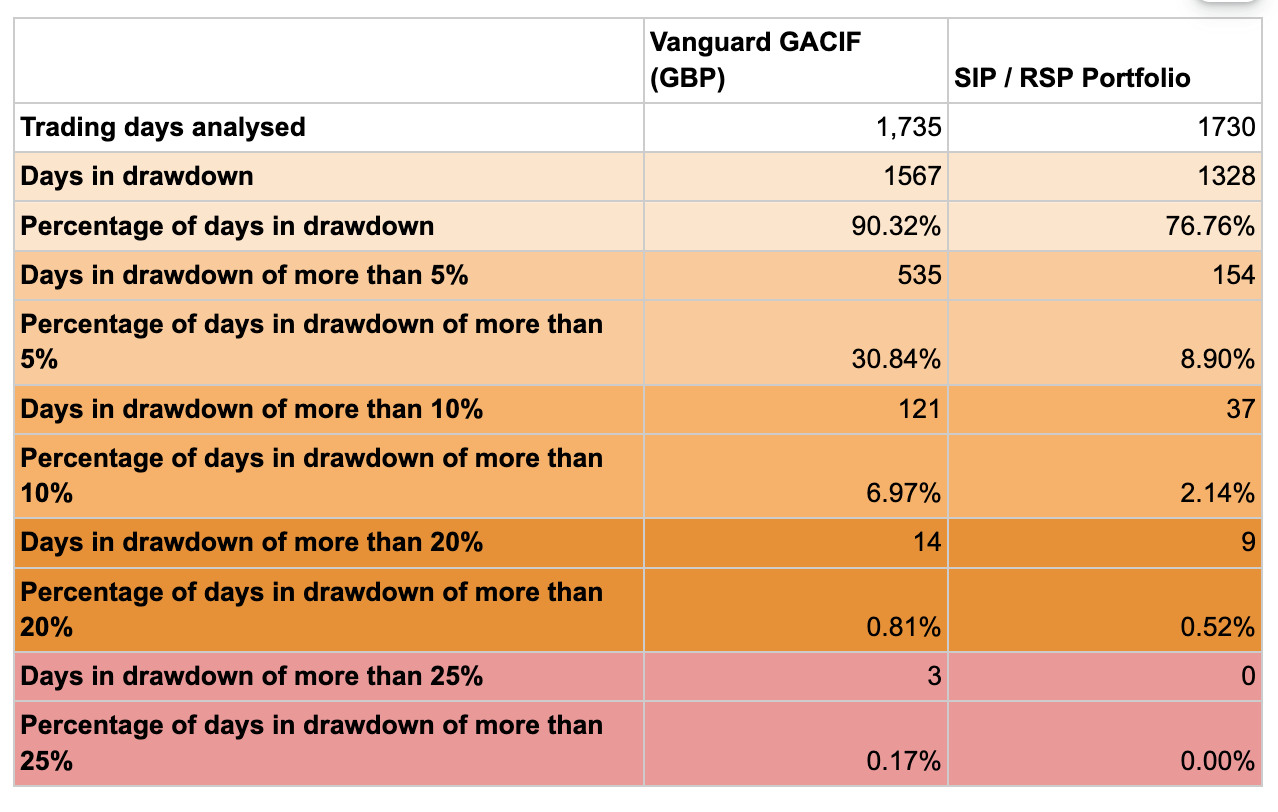
Across every drawdown measure, a regular portfolio spends less times in drawdown compared to the underlying fund.
What about the length of the drawdowns? Again, much better.
The length of the drawdowns are significantly shorter. The only problem however is that there are more drawdowns. This is largely because the averaging of the price tends to pull the portfolio out of drawdowns more often, subsequent to which the portfolio goes back into a drawdown (in essence dividing the drawdowns of the underlying asset into smaller, shallower drawdowns of the regular invested portfolio). Nevertheless both the length of the drawdown and the depth of the drawdown are noticeably better for investors.
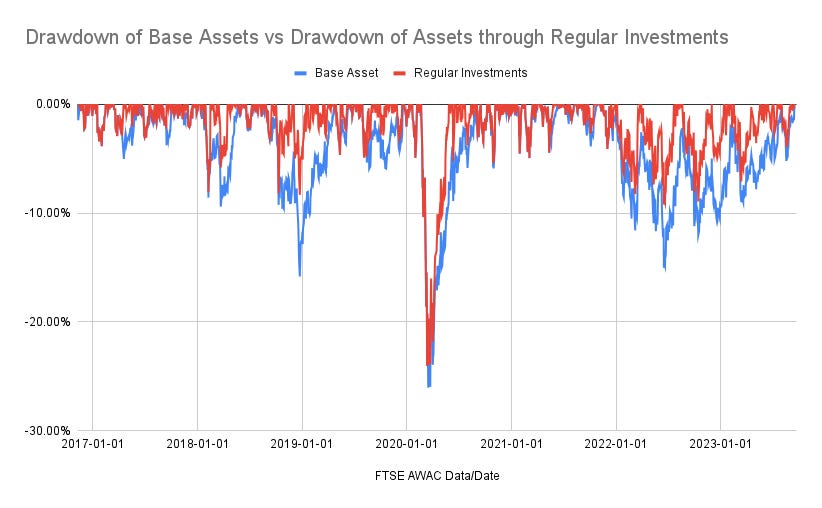
Graphically put, you can see that the blue line (which is for the base fund) is invariably deeper in the drawdown chart than the red one (pertaining to regular investments), and the width of the drawdowns are wider too.
Overall, it seems that investing on a regular basis to reduce the effects of drawdowns, a crucial risk for investors, is effective at achieving that goal. None of this should be surprising - regular investments is one of the basic disciplines taught often to new investors. As an long term regular investor, I have greatly benefitted from adding to my portfolio on a regular basis. It is easy to recommend the same to readers.
Do you have other ideas on drawdowns or regular investing? Drop in your thoughts as a comment.
As always, happy investing!