
A look at drawdowns
A better measure of risk than volatility

Traditional finance media uses volatility as a measure of risk. Volatility is a measure of how much the price of an asset moves. While movement of the price is in itself something useful to know, I believe that understanding drawdowns is a better way of understanding risk.
A drawdown in the investment world is defined as how much lower is the price of an asset compared to its last all-time-high or the last peak of this asset.
(nb: The word drawdown is overloaded, even within personal finance. In retirement planning content, “Drawdown” is also defined as the state where a retiree is drawing down on their retirement assets. Sadly the two definitions in financial world are unrelated and can be confusing. )
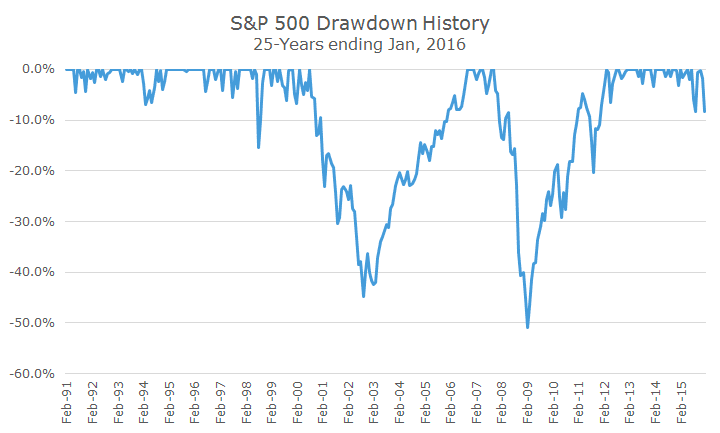
The best way to depict a drawdown is in the form of a drawdown chart, where the peak is noted as the graph hitting the ceiling and then as the stock comes below the peak, the graph charts downwards. The Y axis denotes the percentage decline from the all time high, and is always in negative.
Drawdowns & our psychology
Drawdowns are something interesting to study - the human brain is wired for loss avoidance. Drawdowns are exactly what our brains are trained to avoid in general. Drawdowns can also be painful for investors, be it short term traders, or long term holders like us. Drawdowns have a psychological effect on us. Once we have acquired a share at a particular price point, we are comfortable holding on to it when the price appreciates, and we get uncomfortable when the price declines. So a period of drawdown immediately after the purchase of a stock can be a testing time for an investor.
On the other hand, once you have seen the stock hit a new peak, our brains tend to assign that peak pricing as a normative value of what we hold (emanating from anchoring bias). So when the price declines from there on, even if the price is higher than where we buy, we tend to get uncomfortable and would rather sell if we continue to see a decline away from the peak price.
So, regardless of whether a drawdown occurs immediately after we buy, putting us underwater on the stock, or happens much later, putting us ahead in absolute terms, but underwater to the peak, we tend to have problems with it.
However drawdowns are rather normal. In fact the vast majority of what's traded in financial markets tend to be in drawdowns for most part of their journey in public life. (more on this later in the post)
Characteristics of a drawdown
3 things about drawdowns tell us a lot about the risk of a particular asset:
The total time an asset spends in drawdown. This relates to our ability to be under the last known peak and be comfortable with it.
The depth (or height if you are inverting the graph) of the drawdown - it is a measure of the magnitude of the losses we are willing to stomach.
The width of the drawdown - this pertains to the length of the time we are comfortable being in a drawdown.
Now that we have defined a drawdown, let’s look at some data. Vanguard’s FTSE Global All Cap Index Fund1, which is based on the FTSE All World All Cap Index (pdf), was launched in November 2016. Looking at the data of this particular index over the past 7 years tells us something interesting.
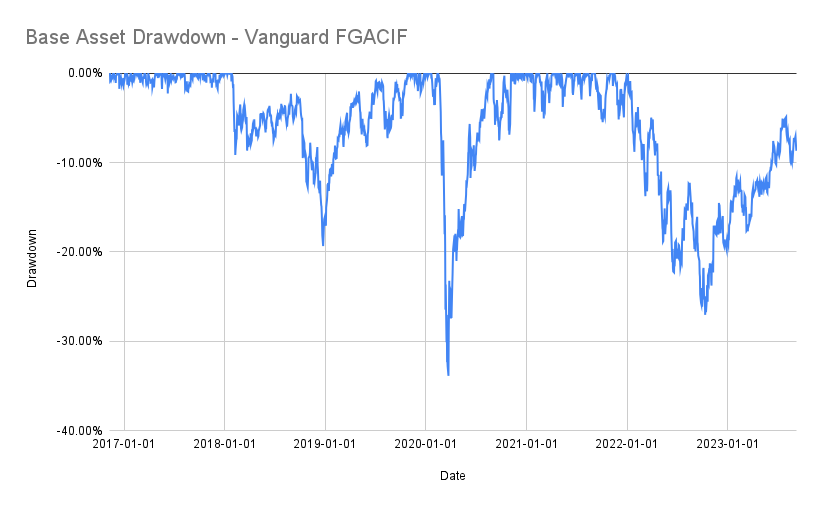
Between 2016-11-08 and 2023-09-08, there were 1725 days of data published by vanguard and across those 1725 days, a whopping 1540 days were spent in a drawdown, or about 90.32% of the time. If you only look at drawdowns of more than 5% of peak, then it took 766 days, or about 44% of the time being 5% below the peak. If you only look at drawdowns of more than 10%, then it has spent 419 days, or 24.3% of the time in larger drawdowns. It spent 78 days, or about 4.5% of the time in drawdowns of 20% or greater and even 5 days or ~0.3% of the time being 30% or greater in drawdown! In fact, it is currently in a drawdown.
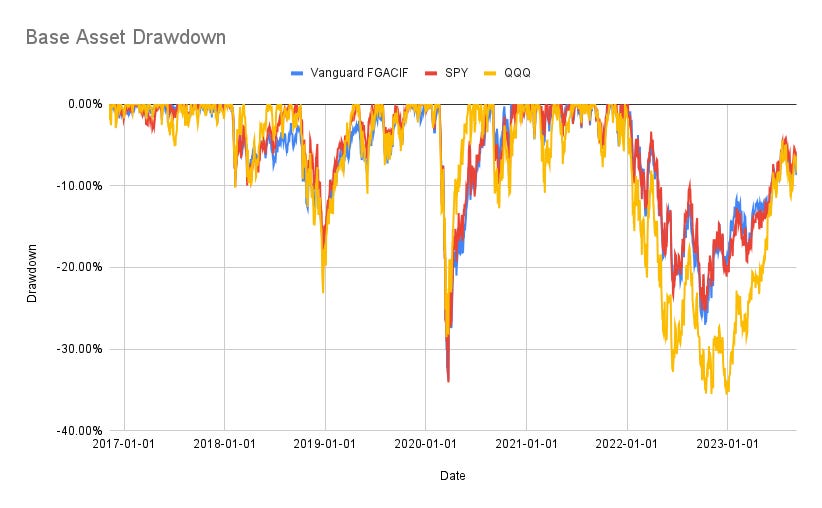
Perhaps it is a problem with this fund? Not at all. Being in drawdown is a norm for this index fund, but it is not unique to this fund in any way though. If we were to compare it to SPY (the primary S&P 500 ETF) and QQQ (the primary Nasdaq 100 ETF), you will see very similar patterns.
In fact, here are the relative drawdown facts for the same time period (1725 trading days):
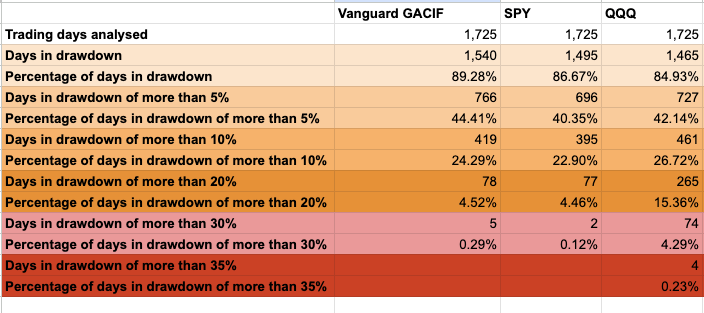
nb: The comparison is not strictly apples to apples because the Vanguard FGACIF is an accumulation fund, while QQQ and SPY both pay dividends and these have not been included in this calculation. The dividends from the ETFs will not change the picture in a material fashion. The graphs will look very similar to what’s presented here.
Further if we were to analyse the length of the drawdowns, we find interesting data:
The fund in question has had 185 drawdowns, with an average of ~14 days being spent in one. SPY and QQQ each have more drawdowns, but their drawdowns last a shorter amount of time.
Summary
If we aren’t investing on the day of the peak of the asset, does a drawdown matter to us investors? Probability not. It all depends on your own psychology and your reactions to changes in the stock market.
The reality, however, is that most stocks, and most funds and indices spend a lot of their useful life in some sort of a drawdown. Almost all investors are going to experience drawdowns for much of their investing life. Understanding them and making sense of them is vital to being an effective long term investor.
Another approach to dealing with drawdowns is to significantly reduce the frequency at which you review your portfolio - drawdowns matter only if you look at it. 🙂
In my next post, I will take a look at how to mitigate the effects of drawdowns.
If you are looking for something longer to read about risk and return, Howard Mark’s latest memo “Fewer Losers, or More Winners” is highly recommended. Here is the text version, and here is the podcast version on spotify.
This is the fund I use as a benchmark to compare the returns of my Coffee Can Portfolio.