
Happy 2xDay FTSE Global All Cap Index Fund!
The first doubling since inception

As many of the readers will know by now, I measure the performance of my portfolio by using the Vanguard’s FTSE Global All Cap Index Fund as my benchmark. In the universe of passive funds, this is among my all time favourites - it is globally diversified, and holds only equities - I like both those tenets. The fund follows the FTSE Global All Cap Index, and is comprised of 7,121 stocks from across the world.
I like to keep an eye on this fund, not only because I use this as a benchmark for my own investing, my family collectively owns quite a bit of this fund across various passive investment strategies, some for our retirement, and some in our daughter’s Junior ISA, which will be available to her when she gets to 18 years of age.

This fund was launched on 8th November 2016 for a unit price of £100. On 15th February, 2024, a few days ago, the fund reached £200 for the first time in its history. I thought I will review this achievement and what it took to get here.

The fund took 7 years and 3 months or ~1836 trading days to double. Along these days, it has had a 993 trading days where its NAV was higher than previous days, and on 835 days it closed lower - put another way, the fund spend 45% of the days closing lower than where it was the previous day and only about 55% of the days closing on the other end.
Pandemic Days
Its worst day along the way was 16th March 2020, when it fell by 8.41%!
Its best day along the way was surprising the day before (13th March 2020), when it rose by 6.32%!!
Both these days happened just at the onset of the covid pandemic, whereby the fund that quoted at 142.69 on 20th February 2020 slid down all the way to 107.8 by 18th March 2020, and then racing away from that nadir to get to 167.47 by the end of 2020. This is reflective of how markets behaved at that time.
(My family continued to hold, and add to our holdings all of 2020. We didn’t sell any of our units. At the time of writing, this fund is 13% of my family’s total equity outlay.)
Analysis of the Up days vs Down days
On the days the fund closed lower i.e. “Down Days”, the average drop was -0.67%, while on the days it inched up i.e. “Up Days”, the average increase was 0.64%. So the fund increased less in value on an average on the days it increases than the drop it suffers on the day it decreases. So, one would believe that fund should find it very hard to go up over the long term. Yet, it only takes a small that the fund spends 10% more of its time being in positive territory than in negative territory. And that makes a lot of difference.
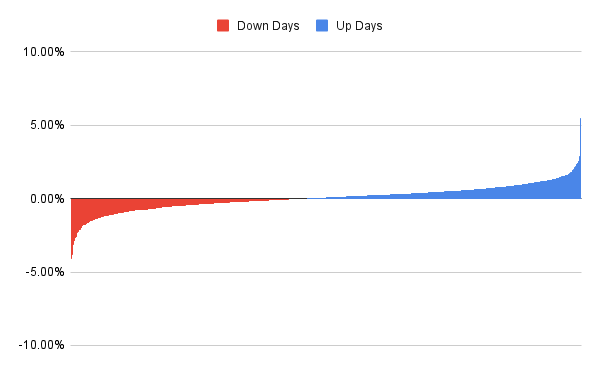
It is also worth noting that the median drop, on the down days, is 0.45%, whereas the median increase, on the up days, is 0.49%. When it drops it spends half its time dropping by less than 0.45% but on the days it is up, it spend half of those days climbing up by 0.49%. That also makes a lot of difference.
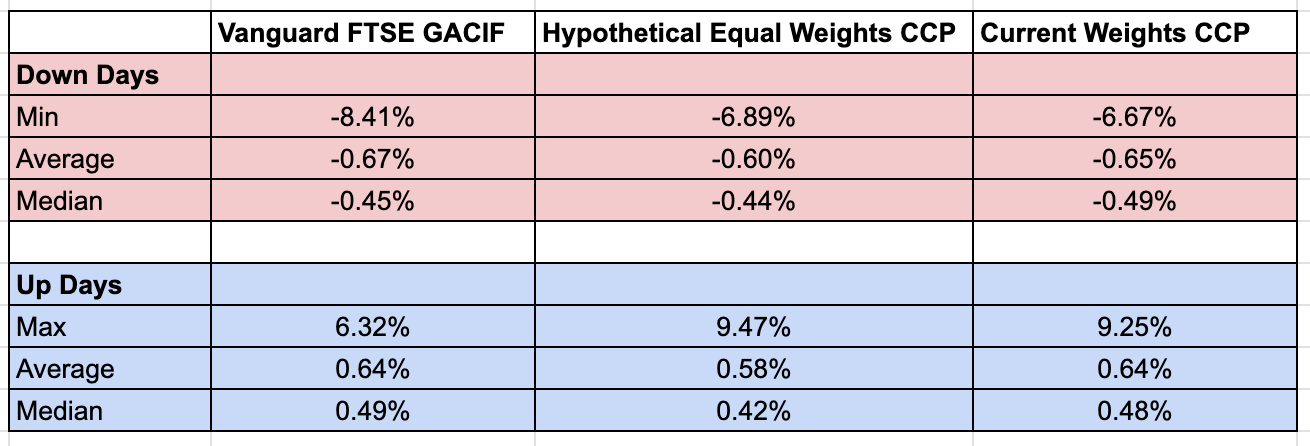
Comparison with Coffee Can Portfolio
Subscribers who joined a while back might recall my posts on Backtesting and Backtesting Volatility Analysis. In those I compare this index fund’s performance to the performance of my Coffee Can Portfolio, either on a hypothetical equal weights1 basis or on the current weights basis.
Incidentally, the 2 portfolios would have reached their respective 2X days, just one day before, on the 14th of March. The comparison of their up days and down days are here - the differences aren’t very notable.
Summary
If the world continues to exist as it has in the past, it is inevitable that this fund will see 4x, 8x, 16x, 32x, 64x, 128x days etc and I very much hope to see all of them, perhaps even the 1024x day. Along the way however, it will suffer more 8.5% down days, or worse; It will also see many days of 6.32% or much better, in the future.
The progress of equity markets can feel volatile and slow, but the steady progress is where the magic happens. Day in and day out, the investment slowly compounds.

As always happy investing!
If you read all the way up to this point, here are some more AI generated images2 to commemorate the occasion.


Disclaimer: I hold positions in some of the tickers mentioned in this post. I am not your financial advisor and bear no fiduciary responsibility. This post is only for educational and entertainment purposes. Do your own due diligence before investing in any securities.
Weights here indicate the weight of each holding in the portfolio.
Prompt for the AI generated images was - “Give me an image to celebrate the doubling of an index fund. The image should be celebratory in nature, but also indicate the fact that the fund went up and down along the way to reach here. It did so in 7 years and 3 months. Please use the digit 2 as part of the image and no text in the image”. Go wild with it if you want to.