
Backtesting
Methodology & some results

As an investor who is putting vast sums of his net wealth into a portfolio, I am often insecure about the future of this portfolio. What if this is a bad combination of investments? What if I end up losing vast sums of money? Am I one of these guys?

Reviewing the portfolio performance every quarter is a reasonable way to keep oneself honest. Knowing what I own and why I own it, also provides some mental security around this process. However, the insecurity never goes away. What do you then? Come up with new ways to find that security.
One such method is backtesting. Backtesting is the process by which you test how your portfolio (or any investing or trading strategy) would have done if started at a historical point of time.
Backtesting investment strategies isn’t trivial - this is because you need to define the set of rules, both buy and sell, and then simulate it through historical data. For starters, comparing historical price to current price is not enough. One must factor in stock splits, dividends etc, to arrive at the total shareholder return across time. If your strategy involves buying and selling, then simulating both of those actions while maintaining complex time series of stock related data can get very complex very quickly. Doing so needs complex programs (or you can subscribe to one off the shelf, but will cost you some amount of money). I am both scrappy and an ardent Google Sheets lover to want to pay for a software subscription!
How to backtest (relatively easily)
For a retail user like us, what’s the best bet then? Luckily, two things work in our favour such that we can obtain pretty good backtesting estimations.
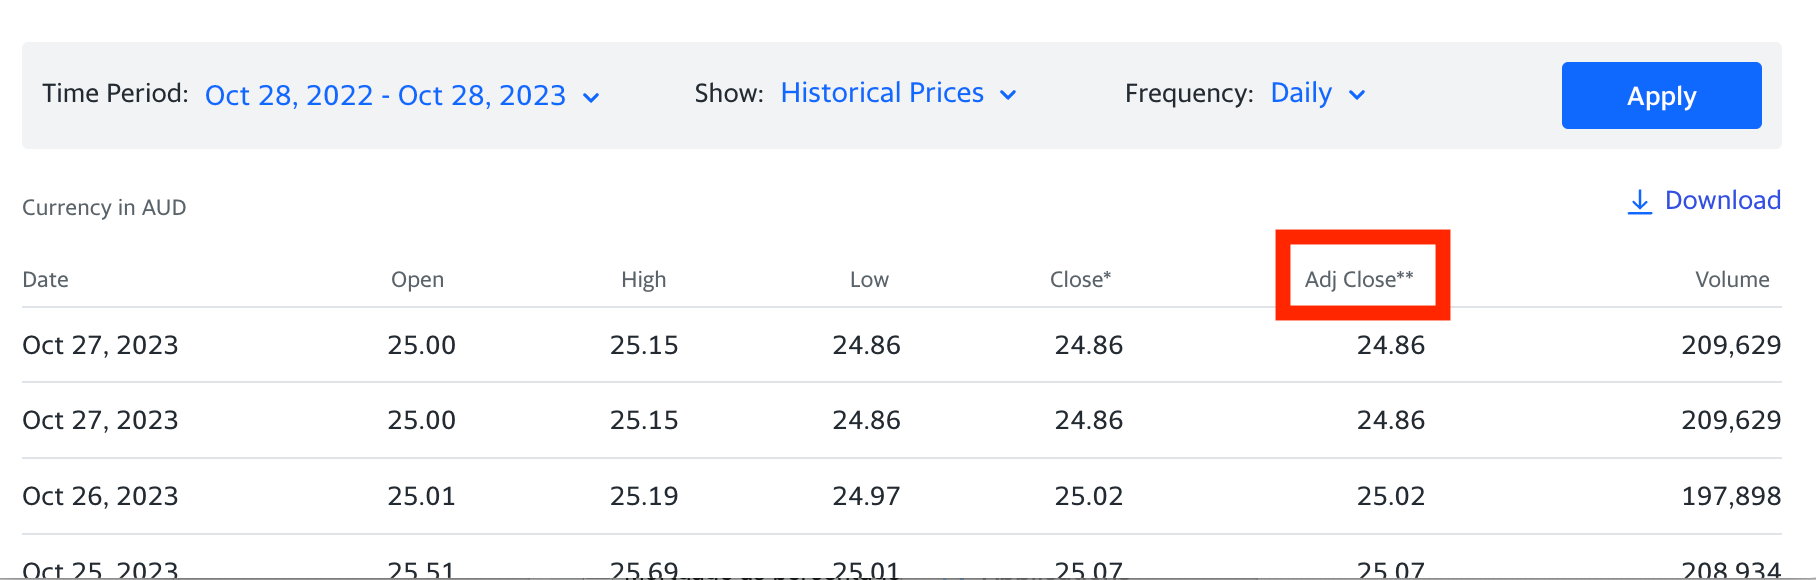
(1/2) Yahoo Finance has a feature where they provide historical price adjusted for stock splits, dividends etc. Let’s take a look at an example. Let’s review our good friend Brickworks. You will find Historical Data tab in the Yahoo page for this stock.
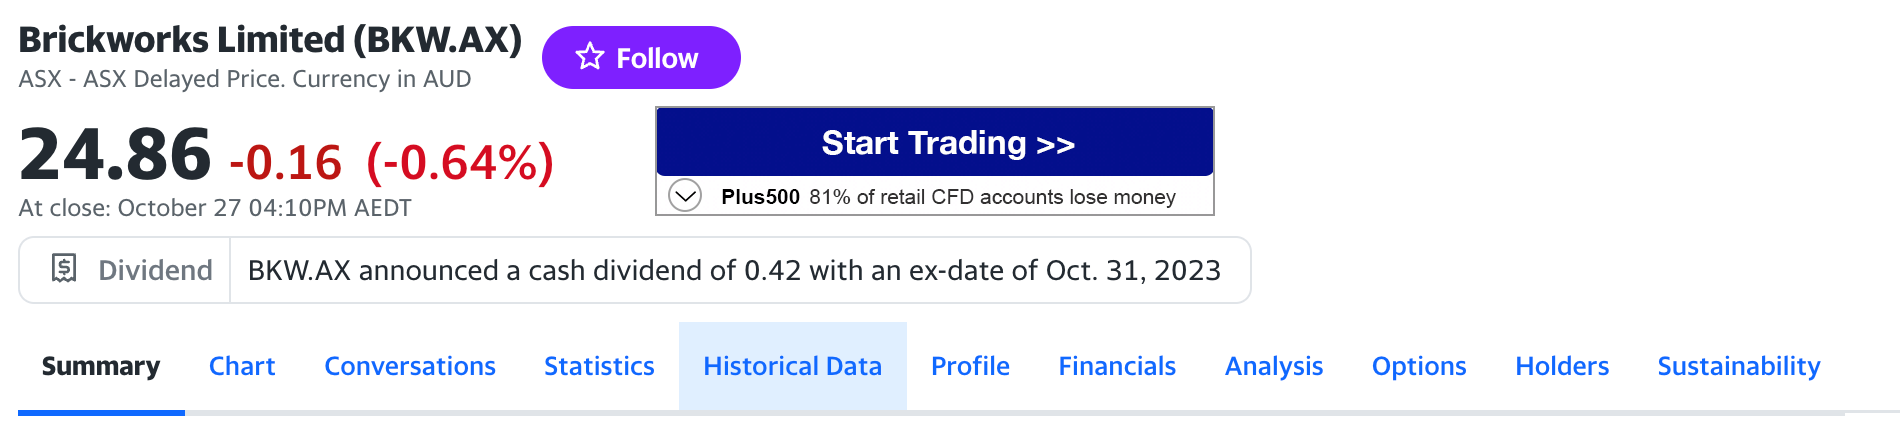
In this tab, there is a column called Adjusted Close. Yahoo describes it as “**Adjusted close price adjusted for splits and dividend and/or capital gain distributions.” - precisely what we want. You can adjust the dates and get the historical adjusted close price of a stock from any date provided on the UI.
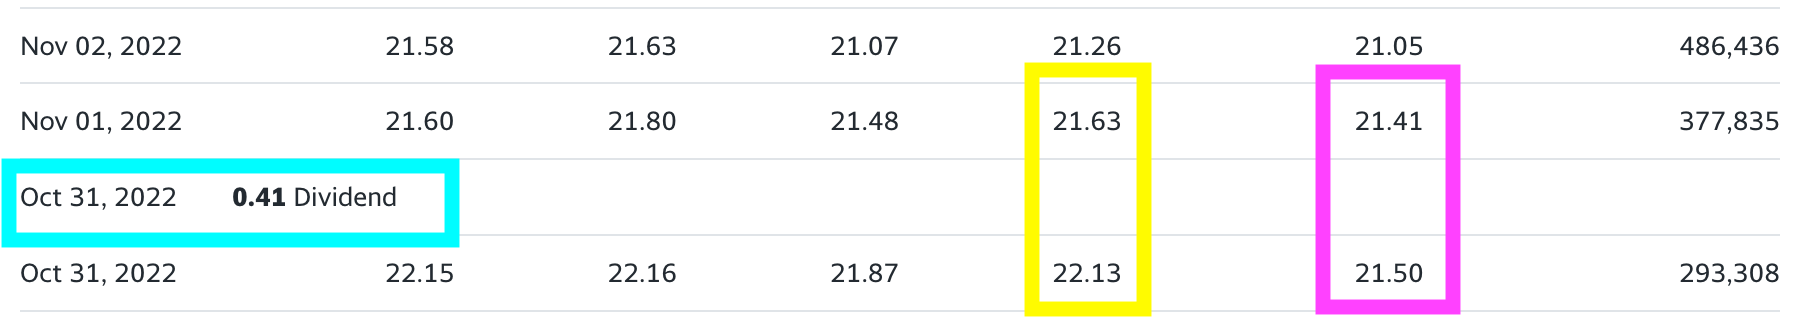
How does this work in practice? Look at this data from Oct 2022, when a dividend was paid out by Brickworks. The closing price dropped a solid A$0.50 (marked in yellow) on that day. However, A$0.41 is recognised as the dividend (marked in aqua) between the previous close and the new close. So, the adjusted price declines only by A$0.09 (in the pink box)
Since Yahoo conveniently provides this data, if one can put together the data for components of a portfolio, you have historical pricing1.
(2/2) Since my portfolio is coffee can style investment, I don’t need to worry about buying and selling. I only need to worry about historical buys, and selling hasn’t happened yet. Then comparing it to current prices gives me everything I need. This simplicity reduces quite a few calculations need to get together a backtesting estimate.
The results of backtesting
Naturally, once I have a method, all I wanted was to run my coffee can portfolio through the backtesting analysis. I chose 8th Nov 2016 as my starting date, since it happens to be the day Vanguard’s FTSE Global All Cap Index Fund was launched for a unit price of £100. This is what I use as a benchmark for my portfolio. That fund has grown to £173.67 today, growing at 8.24% per year across these 7 years. What I wanted to see was whether my Coffee Can Portfolio has outperformed this fund, on an historical basis.
The good news is that the portfolio seems to have outperformed the index fund, but the outperformance depends on the weights in the portfolio.
In an equal weighted scenario, the same £100 would today be worth, £179.92, a marginal improvement of 3.60% over 7 years, or about 0.55% per year of outperformance2.
However, if I use the same weights for each stock as I currently hold, things are dramatically better. Each £100 becomes £195.97, 12.84% better than the index fund, or 1.89% per year of outperformance3.
This is just backtesting data and one should take it with a pinch of salt, but as far as insecurities go, doing this makes me feel that much better than before I did it.
Outperforming Stocks
Now that we have this data, why stop at the portfolio level? Digging one level deeper gives us even more interesting data. A mere 22 (of the 50) tickers have outperformed the market in these 7 years. They are (in alphabetic order):
8053.T (SUMITOMO CORP)
ASX:BKW (Brickworks Limited)
HKG:0992 (Lenovo Group Ltd)
LON:BA (BAE Systems plc)
NASDAQ:AMGN (Amgen, Inc.)
NASDAQ:AMZN (Amazon.com, Inc.)
NASDAQ:COST (Costco Wholesale Corporation)
NASDAQ:GOOGL (Alphabet Inc Class A)
NASDAQ:MDLZ (MONDELEZ INTERNATIONAL INC Common Stock)
NASDAQ:MSFT (Microsoft Corp)
NASDAQ:PEP (PepsiCo, Inc.)
NYSE:BRK.B (Berkshire Hathaway Inc Class B)
NYSE:HD (Home Depot Inc)
NYSE:MA (Mastercard Inc)
NYSE:PG (Procter & Gamble Co)
NYSE:TMO (Thermo Fisher Scientific Inc.)
NYSE:V (Visa Inc)
RIGD.IL (Reliance Industries)
SBID.IL (State Bank of India)
SWX:NESN (Nestle SA)
SWX:NOVN (Novartis AG)
TSE:SJ (Stella-Jones Inc)
Unsurprisingly, over half of these (13 to be precisely) are American Companies - the stock market there has been on an absolute tear in the past 7 years, even after adjusting for the dull past 22 months or so. Both of the individual Indian stocks made the cut (though the index fund didn’t), and 2 of the 3 Swiss listed companies made it to the outperformers list. China has the worst record, having none of its company in the portfolio make it to the outperfomers list. The only Hong Kong listed stock to make it is Lenovo, which is a HK headquartered company.
As always, past performance is not indicative of future results. We don’t know if these outperforming companies will be able to repeat it in the next 7 years. Likely the list will look different, and significantly so, if one asks me.

As I wrote in my portfolio performance post from July, a small number of the portfolio components will eventually give us the outperformance. If we knew these up front, we would only allocate money there, but it is impossible to prognosticate the direction of individual stocks into the future, so it is best to maintain a relatively well diversified selection of good companies, giving us the best opportunity for outperformance.
At the moment, it seems that my portfolio is well positioned for the future. Put another way, my insecurities have been put to rest. At least temporarily.

What are your thoughts about backtesting? Would you be willing to run your portfolio through this process? If you would like me to run this analysis on your portfolio, drop a comment here and let me see if I can whip something up.
As always, happy investing!!
The price obtained through the Yahoo Finance adjusted close price method is adjusted only for cash flows, not adjusted for the time when those cashflows happen. Obviously, a dividend a year ago is more valuable than a dividend today. For instance an adjusted price of £18 might indicate a stock purchased at £24 with six annual dividends of £1 each year. Obviously, paying £18 up front is better than paying £24 and getting the £6 back over 6 years. So, the Yahoo Finance overestimates the outperformance. This is where this approach doesn’t go as far as we would like it to. It is however important to be conscious of this skew.
Read footnote 1 👆
Read footnote 1 👆
Wow man. This is amazing. I bet the volatility was lower too!