
Backtesting Part-2
Volatility & Outperformance analysis

I last wrote about backtesting in Oct’23. I covered how I used historical data to understand how my coffee can portfolio would have done in the past if I had started it the same day the benchmark fund was started.
A comment on the post said
I bet the volatility was lower too!
Ever since that comment, I have wondered what it would be like to have historical volatility data. This is not as easy as the backtesting I did back then, as you now need historical data at not just 2 points of time (i.e. the start and end of the time period in question), but one for every trading day in the interim, in my case, some 1807 days. For each of those 1807 days, I need data for each of the ticker used in the portfolio, along with the benchmark, so some 92,157 data points in total.

This can’t be done by visually going through Yahoo Finance site, as I did for my previous post. This needed some sort of scripting, which is precisely what I endeavoured to do. A few months and a few iterations of the script later, I am glad I managed to collect all ~92K data points and here I am with the results.
Terminology
As a quick recap, results in this post will be presented across 3 portfolios:
Benchmark - Vanguard’s FTSE Global All Cap Index Fund, abbreviated as Vanguard FTSE GACIF in the graphs
Equal Weights Portfolio - a portfolio where all the 50 tickers in my Coffee Can Portfolio are invested in equal weights.
Current Weights Portfolio - a portfolio where all the 50 tickers in my Coffee Can Portfolio are carried at the same weights as it is in the portfolio as of the time of writing.
For the purposes of backtesting, all the three portfolios are rolled backed to 8th November, 2016 - the day the benchmark was launched and rolled forward from that onwards. Data in this post covers 7+ years since that day, up until 5th Jan 2024.
Volatility
I can now plot backtesting data of my portfolio to the benchmark on a day by day basis and it looks like this.
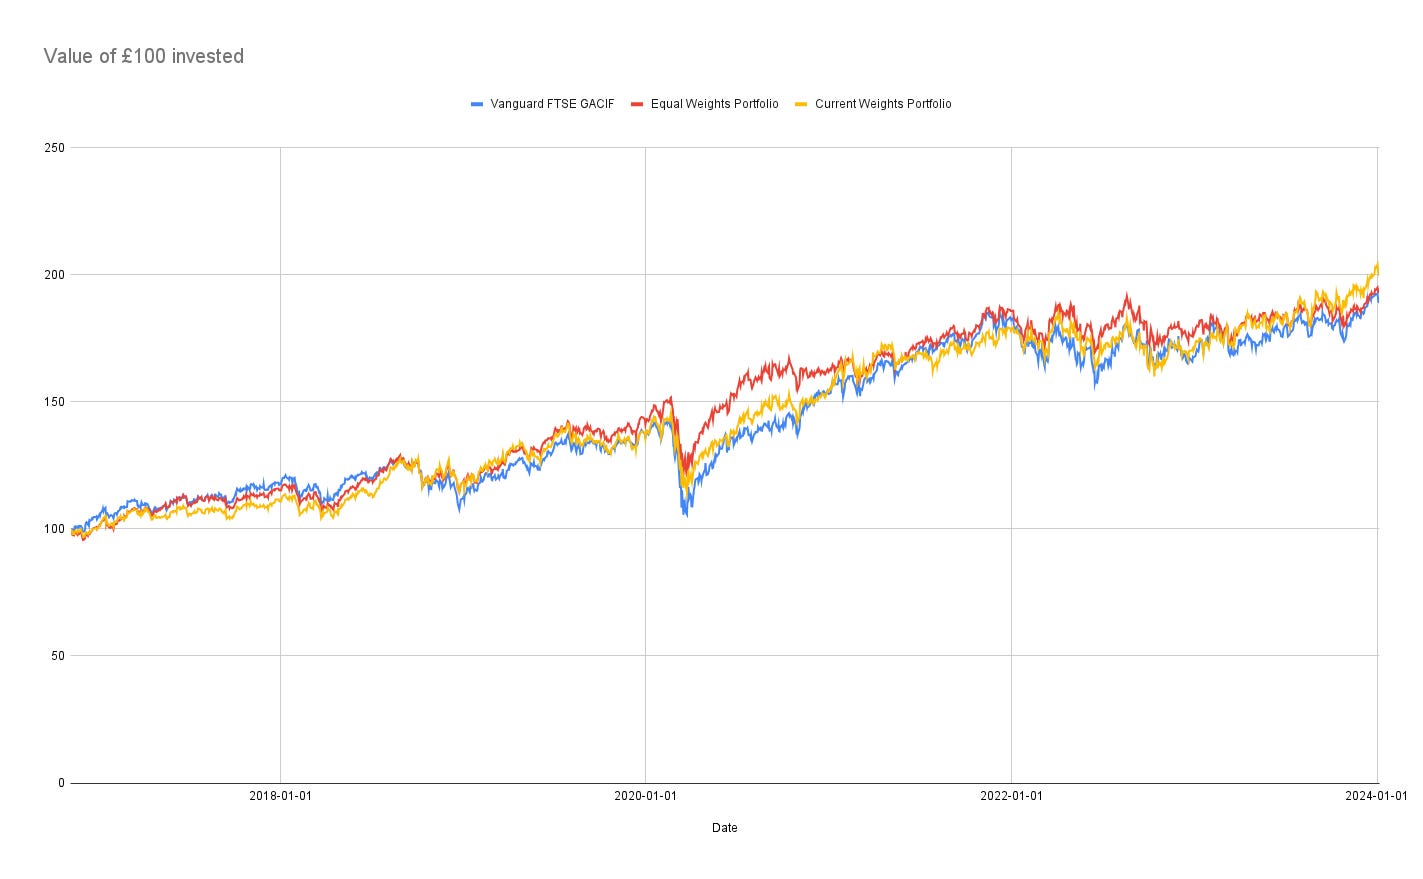
As you can see the charts go close to each other, and to the naked eye, these look similar, but statistically, the gap is quite big. The annualised volatility of the Benchmark is 15.27%, while that of the Equal Weights Portfolio is 13.46% and that of the Current Weights Portfolio is 14.46%. So indeed, the two versions of the Coffee Can Portfolio not only outperformed the benchmark, but also did so with lower volatility, though only by a little bit.
Outperformance charts
Given all of this data, I wanted to see if there is anything else interesting I can spot. One of the ideas that stuck me is an outperformance1 chart - i.e. how does the outperformance of a portfolio over the index track over time?
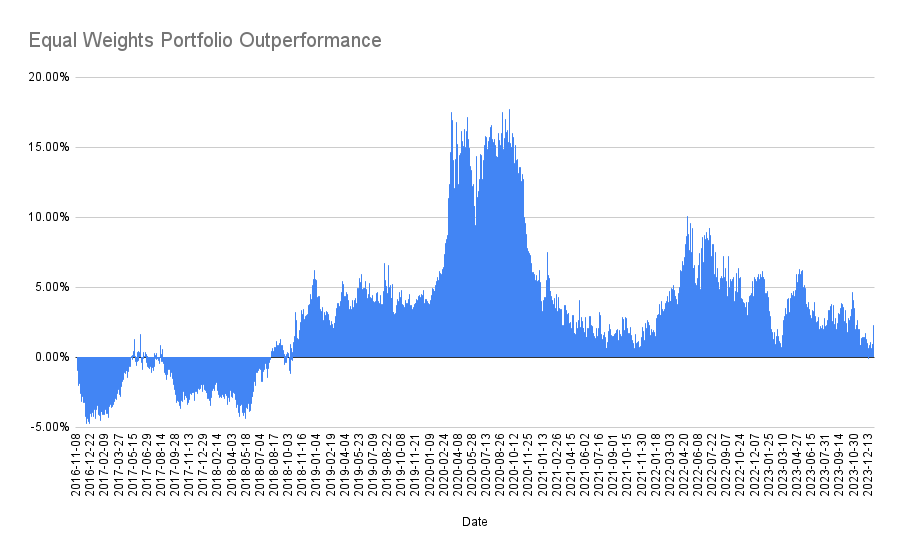
For instance, the equal weights portfolio had a long period - some 2 years - of under performance, after which it had another 2 years of massive outperformance, before settling into a milder outperformance over the next 3 years or so.
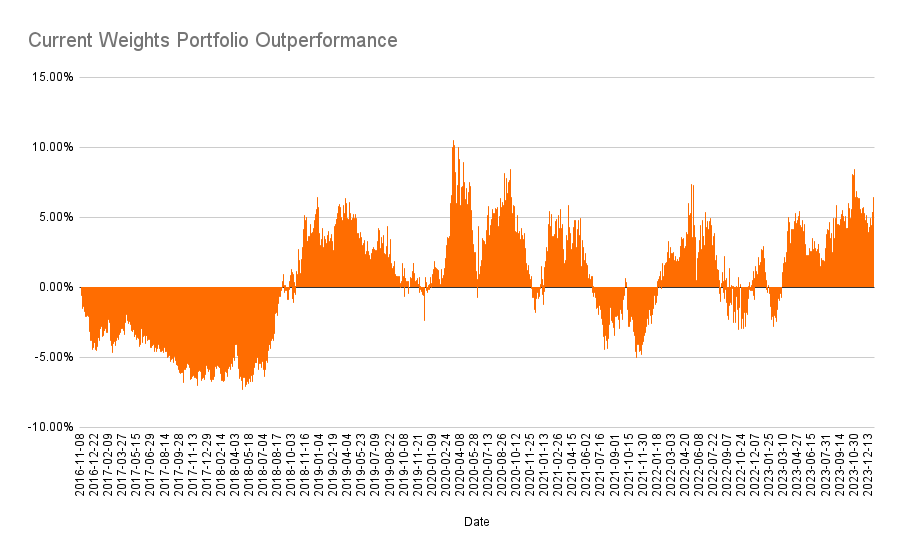
If I redid this for the current weights portfolio, though the outperformance is wider (i.e. higher) when observed today, but it is a lot choppier over time.
Regular Investing
Volatility cuts both ways. If you are a regular investor, some volatility is probably good, as you can capture some investments at lower prices from time to time and hence bring down the average price of your investment. This is one of the factors in the S&P 500 returns I wrote about before the year ended. What happens if we invested in these three portfolios through a monthly regular investment of £100?
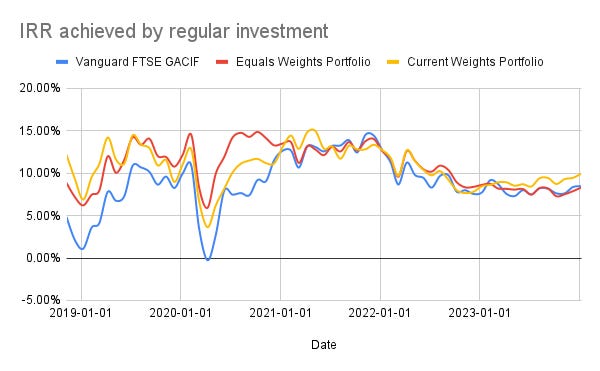
Indeed, the higher volatility captures lower prices of the Benchmark and brings the IRR to date (8.45% p.a.) higher than that of Equal Weights Portfolio (8.31% p.a.). However, the Current Weights Portfolio also benefits from its choppier pricing and superior performance that even on the regular investment route, it produces an IRR of 9.95%.
Summary
Backtesting does nothing more than give you some validation that a strategy *might* work - real proof is always in future results. However from both an intellectual standpoint perspective, as well as a form of due diligence2, it has its merits.
It is clear from these backtests that buy-and-not-sell kind of investing works, producing outperformance & alpha, but it needs a long term mindset. The analysis above tells me that such an investment approach can be testing for fairly long periods of time. It requires significant levels of patience to ensure you stick to your strategy long enough till you can enjoy the sweeter fruits. Coming at a time where the latest quarter showed negative alpha, this is a good reminder to be patient.

I am not calling it “alpha” because it is not adjusted for time. i.e this is this outperformance, not outperformance per year, which is typically how alpha is used.
After all, vast sums of our future wealth will come from these investments. Due diligence will help you sleep well at night.