

Performance Recap
The Coffee Can Portfolio gained 6.99% in Q2 2026, while the benchmark, the Vanguard Global All Cap Fund, gained 13.9% over the same period.
Since inception, performance stands as follows:
Portfolio XIRR (GBP): 10.01%
Benchmark XIRR: 15.59%
Alpha: -5.58%
Unlike Q1, where the whole portfolio underperformed fairly evenly, this quarter’s performance was messier. A few names ran hard while others sat still, and if there’s a skill in producing a particular winning mix, I haven’t found it yet. 🤷
Trimming Winners, Closing Hedges
Lenovo (HKG:0992) and Crocs (NASDAQ:CROX) were the standout winners this quarter, and I trimmed both.
I went into the quarter carrying Gold, Silver and a QQQ short as a hedge. The precious metals had a wild run over the past couple of quarters, but by the end both positions had started to weaken, and since I’d carried them as options spreads, I closed both out (to small profits). The original QQQ short expired worthless, as intended, and I’ve put a new one on with renewed strike prices. I’m happy to keep paying for that protection through the second half of the year, though if history is any guide, I expect this one to expire worthless too.
As a general comment, both the in-quarter loss of almost 7% and the since-inception return of 10%+ sit comfortably within range of what I need to hit my own financial goals. Keeping pace with the benchmark is a different story, and it’s proving tougher by the quarter.
Is This Rally Different?
Every bull run eventually produces a quarter that feels like proof it’s different this time. The benchmark just posted one of those quarters: Q2 2026 came in at +13.9%, pushing it to an all-time high near 291 (base = 100 in November 2016). Worth asking properly rather than just shrugging it off: is this a new normal, or a market getting ahead of itself?
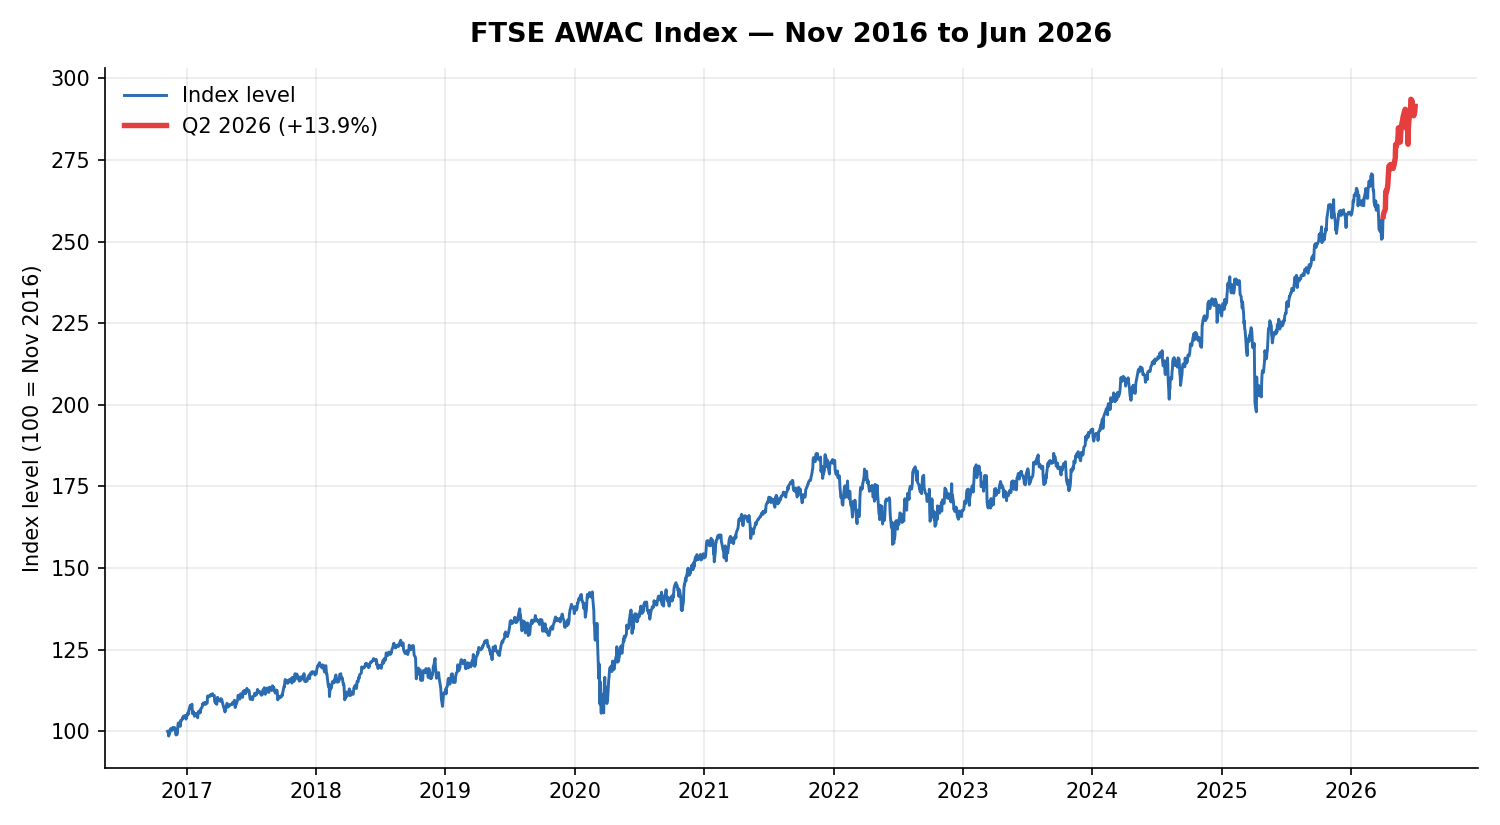
I pulled about 9.5 years of daily data1 on the benchmark fund (Nov 2016 to Jun 2026) and looked at it three ways: calendar-quarter returns, rolling 1/3/5-year returns, and, most usefully, what actually happened after previous quarters that looked this hot.
Short version: by every measure, this quarter and the trailing 1- and 3-year windows sit in the top 2 to 5% of everything the index has done in its short life. The closest historical comparables were followed by below-average, not above-average, forward returns. Not a guarantee of a pullback, but a real headwind for the “sustainable new high” theory rather than a tailwind.
This quarter vs. every other quarter on record
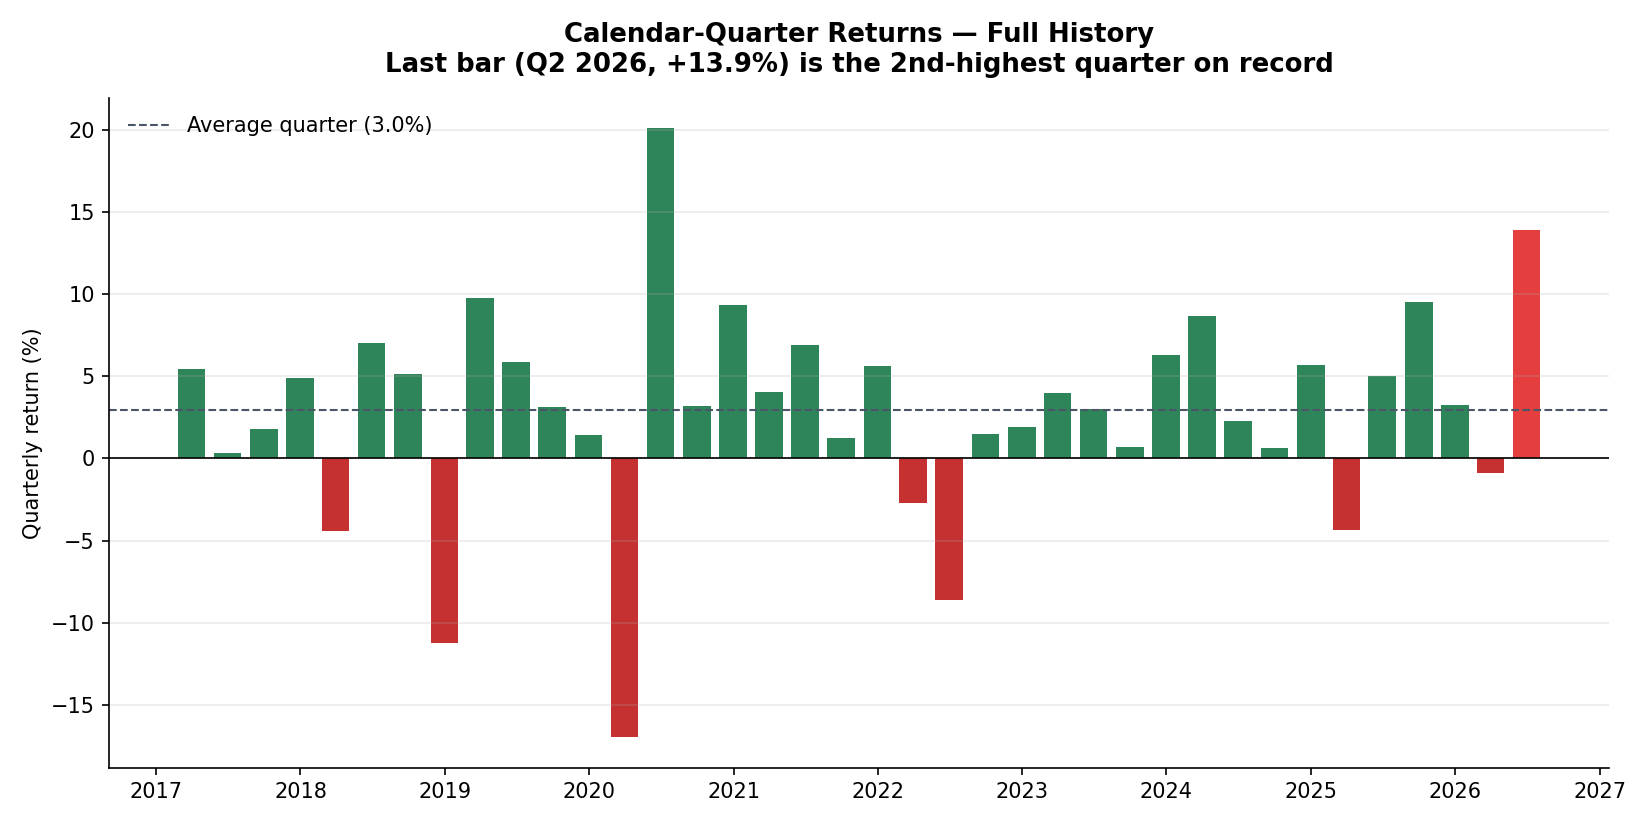
Out of 38 calendar quarters since late 2016, +13.9% ranks 2nd all-time, beaten only by the post-COVID snapback of Q2 2020 (+20.1%). That’s the 97th percentile of every quarter in the dataset.
Top 5 quarters, all-time
Q2 2020 — +20.1%
Q2 2026 — +13.9% (this quarter)
Q1 2019 — +9.8%
Q3 2025 — +9.5%
Q4 2020 — +9.3%
Worth noting that #1 and #5 are both recovery quarters straight after a crash. Q2 2026 has no equivalent drawdown behind it. It’s a hot quarter stacked on an already-elevated market, not a rebound off a low base, which is a meaningfully different setup to most of the rest of that top 5.
How stretched is the trend, not just the quarter
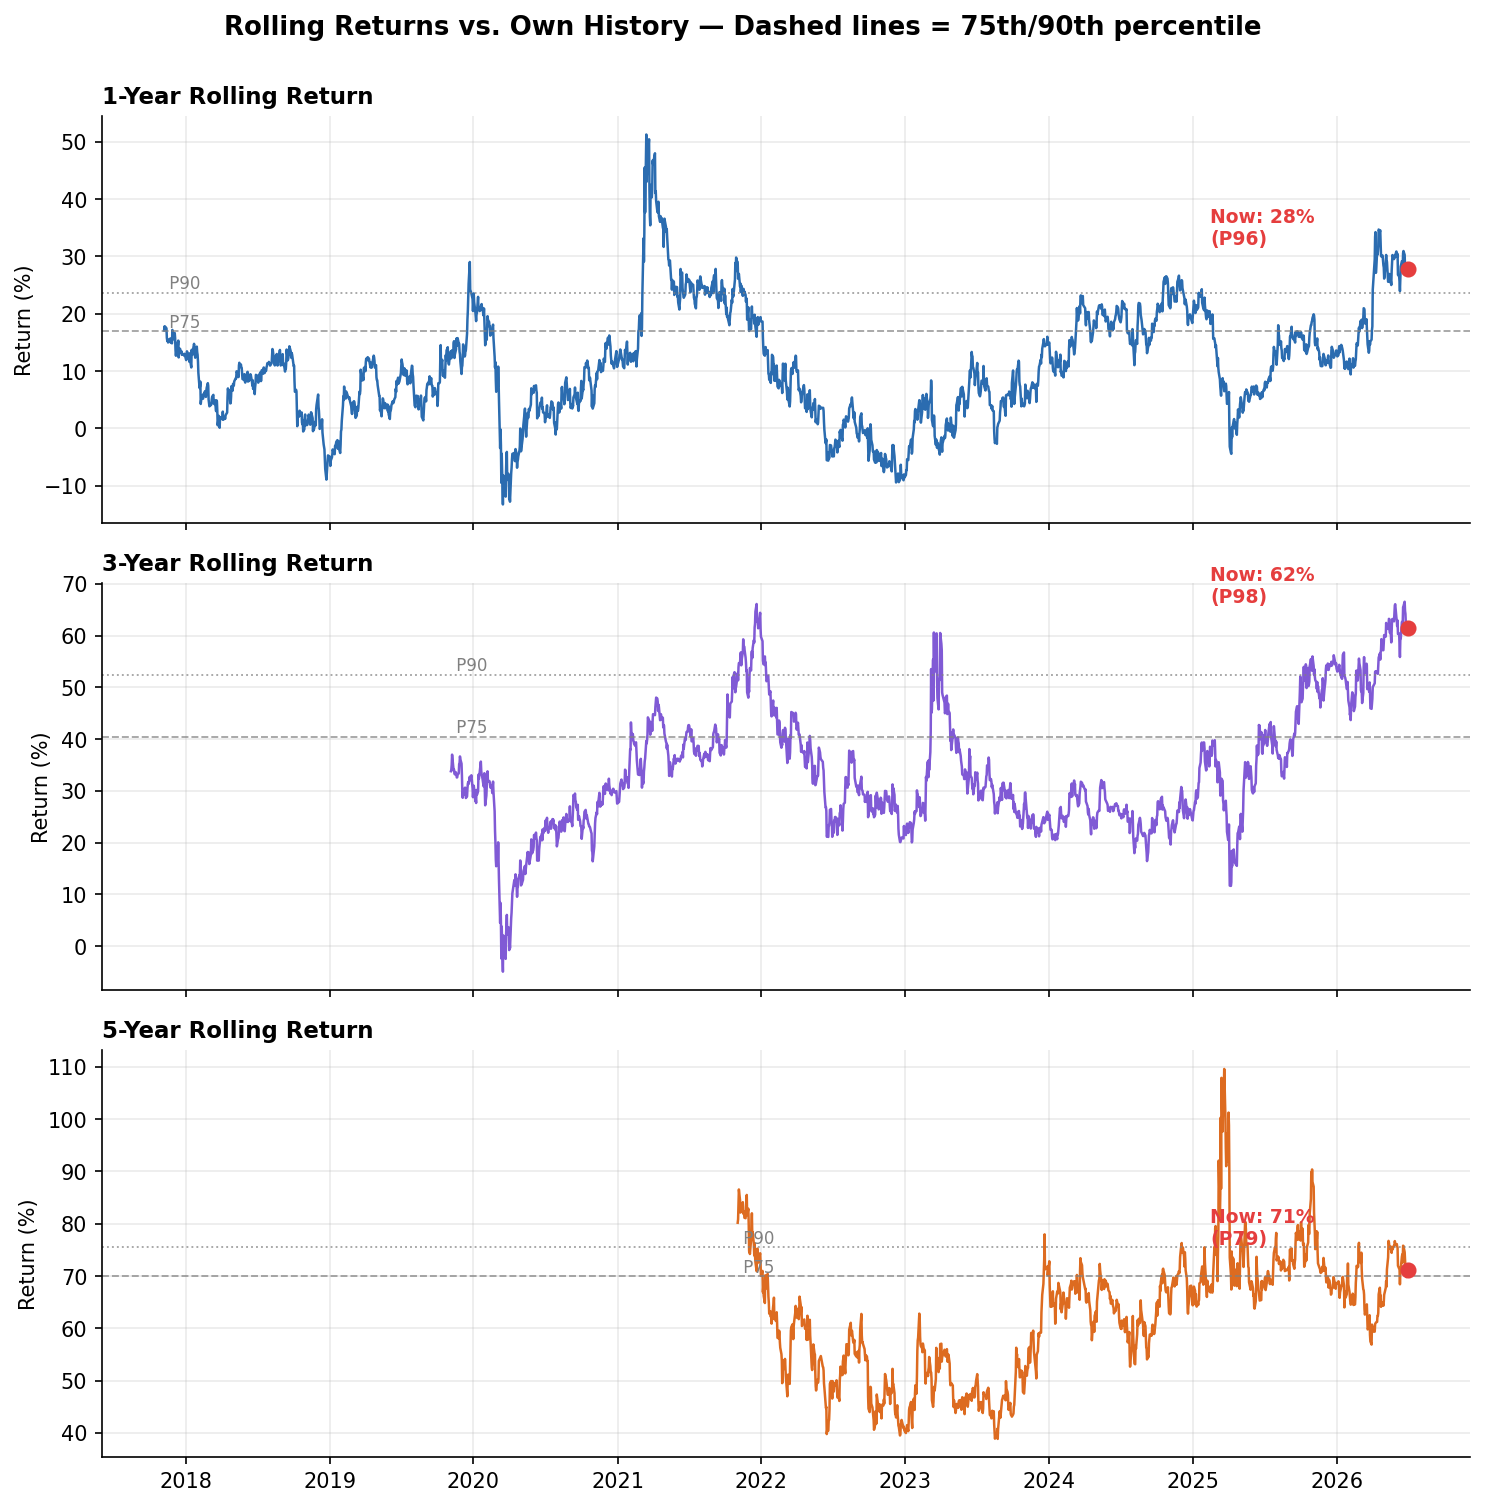
A single quarter can be noise, so rolling windows are more telling:
1-year rolling return: +28%, the 96th percentile of all trading days since 2017
3-year rolling return: +62% (roughly 17%/yr annualised), the 98th percentile
5-year rolling return: +71% (roughly 11%/yr annualised), the 79th percentile, elevated but noticeably less extreme
That gap matters. The 5-year figure is only moderately stretched because it still has the 2022 drawdown inside its lookback window. The 1- and 3-year numbers are the real outliers, built almost entirely from the post-2023 melt-up with no offsetting down leg. That’s a strong sign of a trend running hotter recently than its own longer-run average.
What happened after previous froth episodes
This is the part that actually tests the theory. I flagged every historical quarter where QoQ, 1Y, 3Y or 5Y rolling returns hit their own top quartile, then checked what the index did in the following quarter and following year.
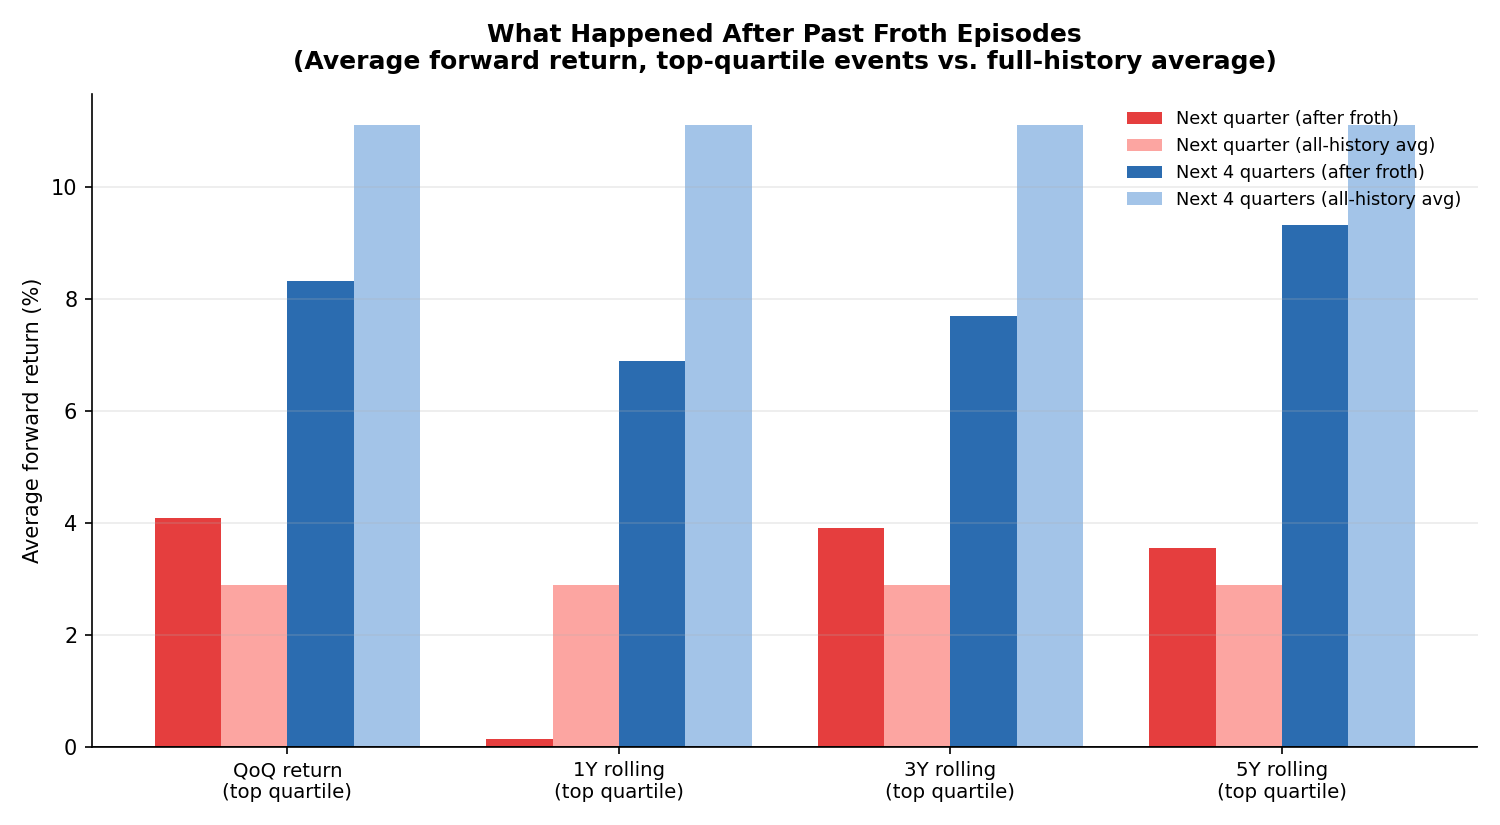
Across all four measures, the pattern holds: returns in the quarters right after a top-quartile reading came in lower than the index’s average, sometimes by a wide margin. The 1-year-rolling cohort is the starkest example. The next four quarters averaged +0.6%, against an all-history average of +11.1%.
A few specific episodes side by side:

Dec 2021 (3-year rolling return of +60%, top-decile): the index went essentially sideways to down for the following 18 months, the setup right before the 2022 drawdown.
Mar 2021 (1-year rolling return of +47%, also top-decile): the run continued for a couple more quarters, then flattened out for most of the following year.
Jun 2020 and Mar 2019 (froth from a rebound low): these did keep running, but both started from a depressed base after a drawdown, unlike today.
Momentum froth close to already-high levels, closer to today’s setup, tended to precede stalling or drawdowns. Froth off a low base tended to keep running. Q2 2026 looks structurally more like the former.
Back to the Portfolio
None of the above changes what I’m doing with the Coffee Can Portfolio - the vast majority of my positions are still trading well below their past highs, in several cases at genuinely low valuations. That tells me the ability to sustainably compound at 10%+ from here remains intact, even if the benchmark itself looks due a possibly cooler patch. I also have a reasonably big holding of the same benchmark fund in my ETF holdings and I plan to just leave it intact.
Do you buy the froth argument, or do you think this time really is different? Curious what others are seeing in their own numbers.
Until then, happy investing.
Disclaimer: I am not your financial advisor and bear no fiduciary responsibility. This post is for educational and entertainment purposes only. Do your own due diligence before investing. I may hold or enter into positions in the securities mentioned above. This is not a solicitation to buy or sell any security.
Data: daily closing levels, Nov 2016 to Jun 2026. Quarterly returns on quarter-end closing values. Rolling returns on trading-day windows (252/756/1260 days, roughly 1/3/5 years), sampled at quarter-end for the episode analysis.
It was such a weird quarter- because it was a different news story every day. Even though it was a great quarter, it didn’t feel like it.
It’s felt like a boxing match that went all 10 rounds, and ended up with a broken jaw, eye, wrist and hand. But you won by unanimous decision.