
Income from occupation vs Gains from Investments
One overtakes the other rather quickly

When I graduated from college, the focus of my career was to learn, grow, take on more responsibilities, and prosper both in my career and in my income. This week, I am coming up on 20 years anniversary of starting my career.
I admit that I have been very fortunate to have a great professional life. From fulfilling roles both as an individual contributor to manager to leader, to wonderful colleagues and partners and supervisors and managers, who have guided me, tolerated me, brought out the best in me; I have had a good ride. Thank you!
But I am here to talk about something beyond my career.
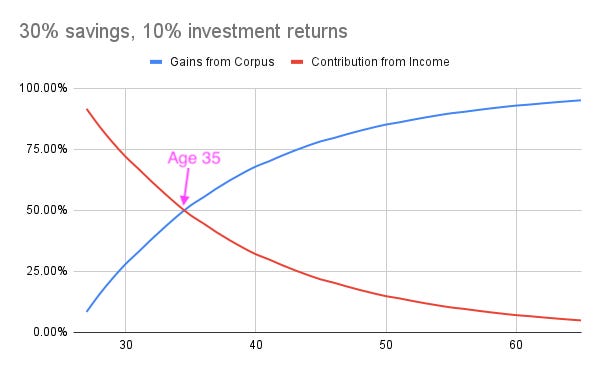
Alice
Imagine a young professional, Alice, who starts her career at the age of 26 making £45K with good prospects ahead. Her salary grows somewhat fast in the early years and then settles down into a rhythm in the later years. She is also disciplined, setting aside 30% of her income every year and invests it diligently, and compounds it at 10% a year. At the rather young age of 35, or 10 years into her career, the gains from her capital invested starts surpassing the deposits from her income. So, the corpus is gaining more from growth of the past deposits than it does from new deposits.
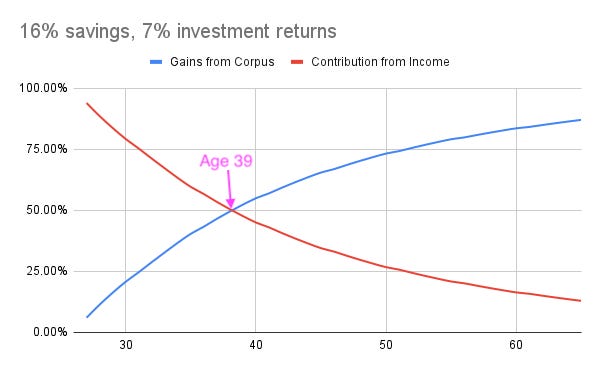
Bob
You think those assumptions (30% investment, and 10% investment returns) are too outlandish? Okay, let’s take his brother, Bob’s, example. Same career trajectory, but he only saves 16% of his income, and invests poorly and only gets a 7% return on his investments. He gets there at the age of 39.
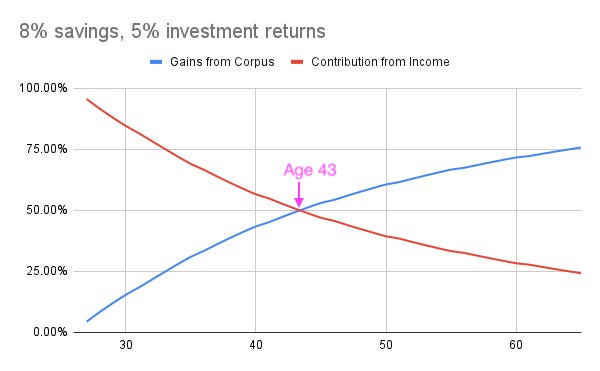
Carol
Their youngest sister Carol, is even worse than both of them. She only puts away 8% of her income every year and generates a mere 5% each year in returns. While she might take a bit longer than her elder siblings, she gets there too at the age of 43.
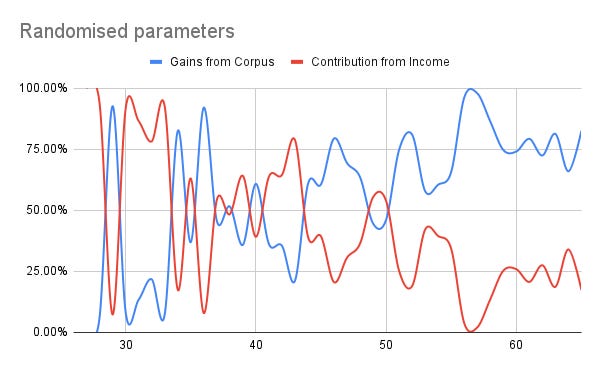
Dylan
I am aware that most people’s actual experiences are going to be a bit haphazard. People’s increments are going to go through good and bad years, and their savings each year can be a bit random, and their returns can be volatile. As an example, here is a quick simulated run for their brother Dylan, who has all his parameters randomised.
Even with all the randomisation Dylan’s contributions going back and forth, at some point his corpus picks up the load, at around 50 and carries it1.
The case with migrants
One clear exception to this kind of trend is when people migrate across economies of very different wage structures.
Imagine Azadeh, following Alice’s career for a few years in Iran and then deciding to move to US. Her current corpus built in a lower wage country will be significantly smaller than her new wages in the US2.
Vice versa is an equally strong exception. If Bernado follow Bob’s example for a few years in the US and decides to move to Venezuela3. His existing corpus will overwhelm his new wages.
In both cases, there will be a step function in the graph and while the trend can normalise over time, mental expectations might significant alter with an event like that.
The case with entrepreneurs & startup employees
Meet a startup entrepreneur and you will often find that their incomes and investments are blended together into the startup opportunity. If their startups raises their next round of funding, the value of their company goes up, but often also means the opportunity to increase their own salaries. Somewhat similar is the story of startup employees. With improving fortunes of the startups, its employees enjoy better salaries as well as better valuations. So the ability to separate out the income and gains lines becomes harder.
Summary
Despite the exceptional cases mentioned above, the general line of thinking applies to vast majority of us. If that’s the case, perhaps time to consciously think about these graphs? If interested do these calculations yourself (having a good personal finance dashboard might come in handy). A couple of takeaways for the readers of this post:
How much of your annual corpus growth is coming from new money you are putting from earnings vs how much is coming from growth of past capital?
What are you better off maximising at this stage of your life? Earning more? Growing your investments better?
These aren’t easy questions to answer. However, you might fund the answers illuminating. To get you started, here is the sheet with my data - feel free to copy it and play with it.
As always, happy investing!
Dylan’s example depends on randomisation and one can run it as many times as desired and get as many results. I chose the one with any kind of trend in it.
Based on current difference in income and per-capita GDP levels between Iran and US. Countries selected purely for illustration.
Based on current difference in income and per-capita GDP levels between Venezuela and US. Countries selected purely for illustration.