
Building a Personal Finance Dashboard
Only a few things matter

I have been a bit busy the past 2 weeks and haven’t had time to put together new content. So this week’s post is going to be a bit light. However, I think it is an important topic - it is instructive for investors to have a relatively good understanding of how their finances stand. Hence, bringing up the topic of building a Personal Finance dashboard today.
When I moved to the UK and had a workplace pension account opened (with Aviva), they sent me a letter which showed me a projection of my pension based on the contributions and some assumption for growth. I found the idea compelling, but Aviva’s projection useless - so little of my money was in Aviva at the time that their projection was looking at too little of my actual financial status.
After looking around for software that could do this, and not finding one I was satisfied with, I decided to create one of my own. I have pretty much all of my financial assets stashed away in a maze of Google Sheets, which are eventually brought together (thanks to the wonderful importrange function) into a single sheet, boringly called “Summary Sheet”.
Once I did that, I committed to spending a few minutes each month in creating a snapshot of the assets at that point of time. Having done this for a few years now, I have a series of historical snapshots of my corpus. That has formed the basis of the graphs I wish to share with you today.
My personal finance dashboard is comprised of a few simple, intuitive metrics that I care on a regular basis.
(ps: the left hand axis has been blanked out to protect the confidentiality of my finances. In any case, I want to provide a framework and having numbers there is distracting.)
Net Worth
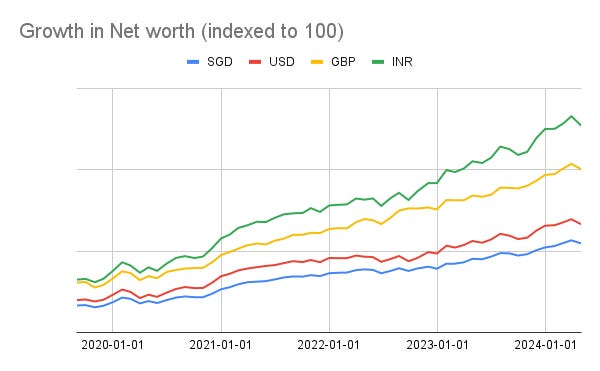
As can be expected, the most basic metric is Net Worth (a.k.a Corpus). The target of financial planning is to get this past the Financial Independence threshold, or the first the Financial Equilibrium threshold. Tracking it on a regular basis helps me understand where I am. I do so in 4 currencies, but that’s just redundant, and a byproduct of the fact that I have been a migrant and lived in 3 countries and use USD as a benchmark currency. One currency - the one of the place you plan to live in should be more than enough.
Growth in Corpus
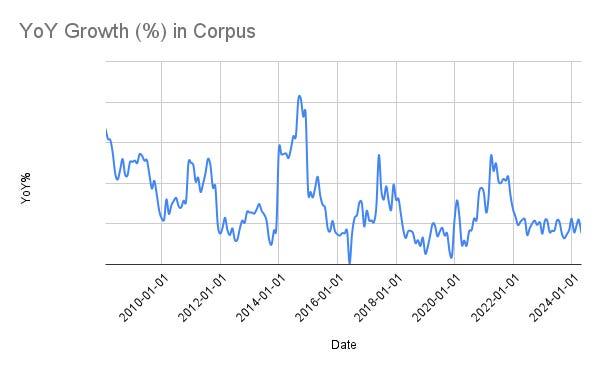
The next metric I care about is how my corpus is growing on a year-on-year basis. This includes both (a) the growth in the corpus through investments, as well as (b) the new deposits I make into the corpus. As you can imagine, there were past periods where my corpus grew much faster (largely due to money I was putting in; growth has been somewhat predictable), but as I get older, I can’t contribute nearly enough to move the needle on the corpus, at least relative to how the corpus grows on its own. As you can see the blue tine is ticking lower - this is fine and largely to be expected.
IRR
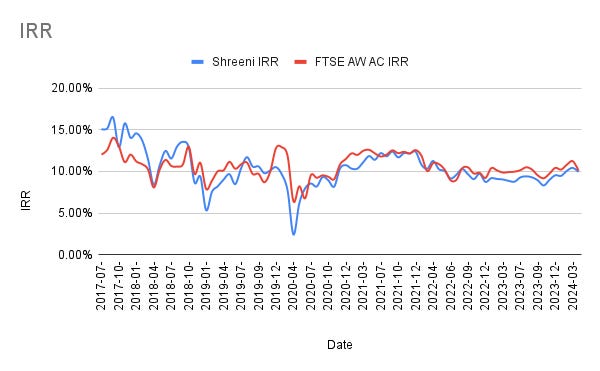
Internal Rate of Return (IRR) is the next metric I care about. This is a measure of return of the investments in the portfolio after adjusting for monies going in and out. This represents how good my portfolio is performing (or it might do if I had no external cashflows - in or out into the corpus). As always I compare it to my favourite benchmark - Vanguard’s FTSE Global All Cap Index Fund. It is largely tracking the benchmark - no surprises there - my portfolio is structured so.
Net Worth as Percentage of Incomes
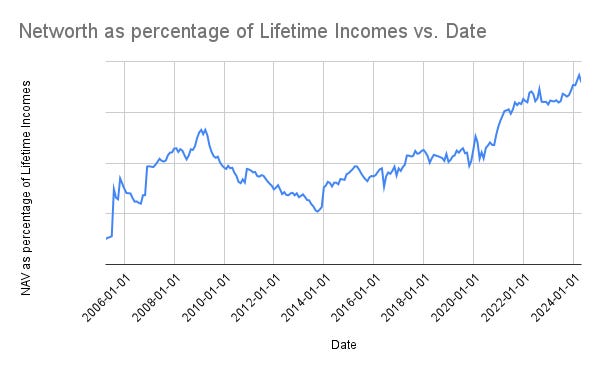
A retirement corpus should last you the entire retirement period. So much analysis and maths has gone into frameworks that allow us to achieve this point - most common being the safe withdrawal rate. However, I am also interested in what part of my past earnings (post-tax) does the investment corpus represent. Just imagine knowing that your past 30 years of post-tax income is already sitting in your corpus (through the investment performance of your portfolio), then that’s an additional validation of the safety and sustainability of your retirement corpus.
Safe Withdrawal Amount
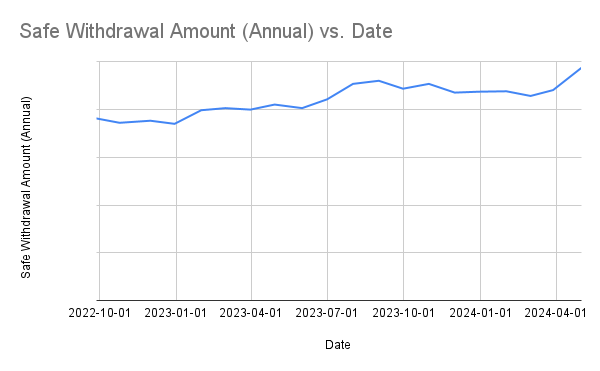
The last metric I look at is the safe withdrawal amount. I take the corpus and calculate the current liquidity value - the current liquidity value will always be much lower than the corpus - because of taxes (and sometimes other liquidation related costs) that will need to be factored in if I liquidate them ahead of their planned maturity date. For example, my pension corpus is £10,000 only when in a pension account, but if I took it all out today at 45% tax rate, then that carries only a £5,500 liquidation value.
One can easily convert the total liquidation value into an safe withdrawal amount - using a 3% or a 4% safe withdrawal rate. If this number matched my current expenses, Voila - I am done with achieving Financial Independence!
Summary
I am well aware that this is too much to do for most retail investors. I don’t expect them to do, though I expect most readers to have an instinctive feeling of where they stand with most of the metrics (at least the corpus). If you engage a Financial Advisor I would strongly urge you to get them to produce some if not many of this metrics. It will help you understand where you stand and help you make better decisions.
As always, Happy Investing!!
Nicely summarized & very helpful. I too have investments across multiple geographies & currencies - nomadic immigrant! I tried to standardised across sheets but always struggle to update with the need to do it manually; thus do it not as frequently as I would like.