
Harvesting Volatility - part III
Returns Are Optional. Patience Is Not.

My (slightly unhealthy) obsession with volatility harvesting continues. This is yet another post full of stats and charts, but it is likely the last in this particular series. At this point, I have explored the idea far enough to form a reasonably informed opinion, at least for now.
A Quick Recap
In the first post, we explored a deliberately simple idea: build a trading strategy around consistent buying, and book profits whenever a predefined return threshold is reached. Then go back to cash and repeat. No forecasts, no leverage, just patience and repetition. We tested this using VWRL, a globally diversified equity ETF.
In the second post, we extended the analysis to SPY and QQQ, both higher volatility and higher return ETFs. The results were interesting. QQQ, in particular, required meaningfully more capital during drawdowns, but it also delivered substantially higher returns. At least on recent data, the trade-off looked attractive.
But there was an obvious blind spot.
The backtests only went back around thirteen years. That sounds like a long time, but it conveniently avoids two of the ugliest drawdowns in modern market history: the 2000 dot-com bust and the 2008 global financial crisis. Both hit QQQ and SPY hard. VWRL, launched only in 2012, simply did not exist during those periods.
Any trading strategy that claims robustness needs to be tested against the worst cases, not just the most recent bull run. Testing solely on the last thirteen years, most of which were strongly upward trending, would be disingenuous at best.
So let’s push QQQ further back.
QQQ Through the Ugly Bits
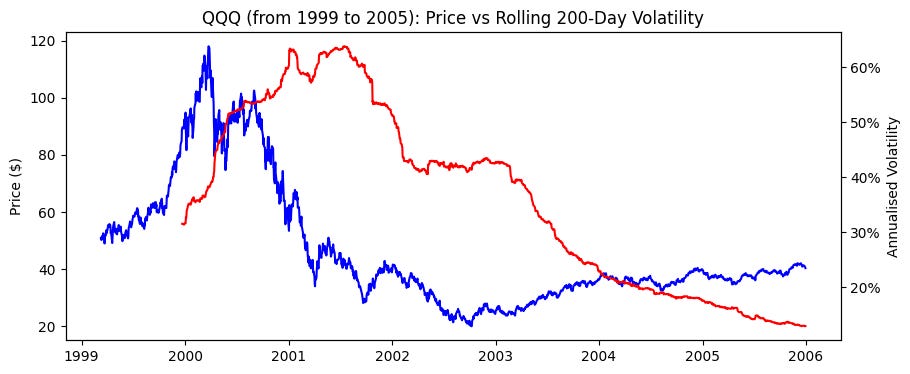
QQQ has had a chequered history. From its launch in 1999 through to 2005, following a spectacular ascent into the first quarter of 2000, it suffered one of the most brutal drawdowns experienced by a broad-based Western equity ETF in modern times. Japan did worse, but that is a different story altogether.
As you look at the chart below, pay attention not just to price, but also to volatility.
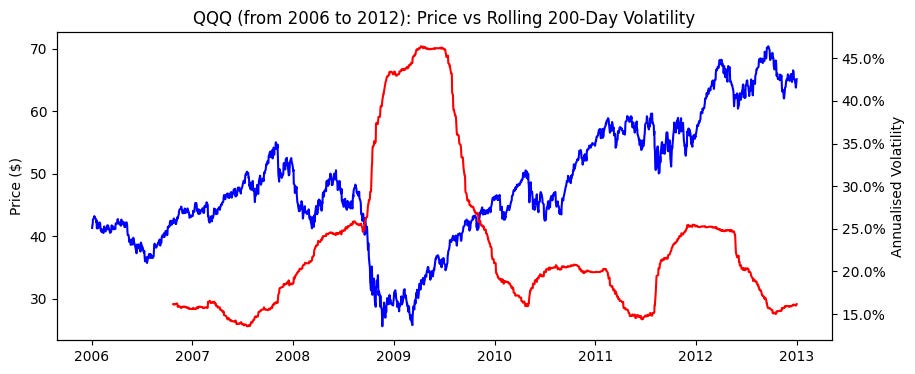
Rolling the clock forward another six years, from 2006 to 2012, the picture improves slightly. After wobbling violently during the 2008 financial crisis, QQQ eventually ended the period higher, but not by much. Roughly 50 percent over six years.
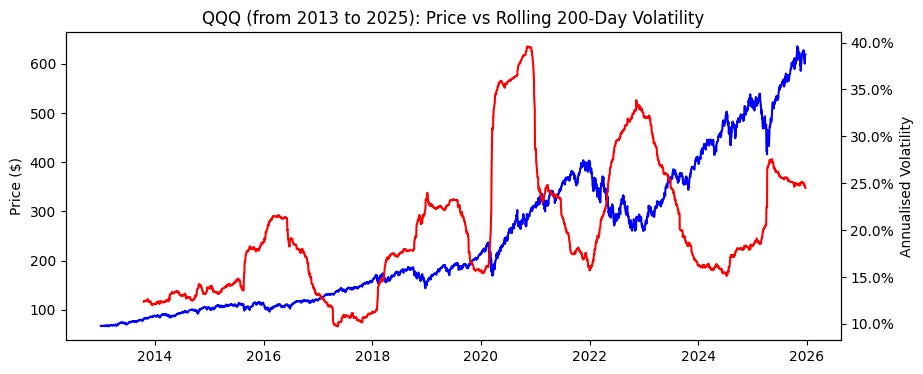
Then came the era QQQ is now famous for. From 2012 onwards, it went on a staggering bull run, rising roughly sixfold over thirteen years. Equally striking is what did not happen: volatility never returned anywhere near the peaks seen during the dot-com crash or the GFC.
Put together, QQQ has clearly been an outstanding long-term investment. But it has also gone through extended periods of deep drawdowns, stagnation, and extreme volatility. The natural question is whether the volatility harvesting strategy survives those regimes.
Running the Strategy Through the Full History
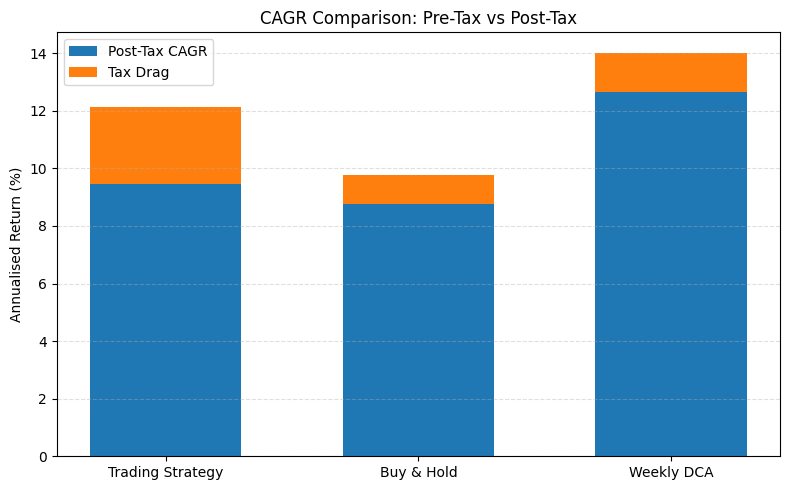
If you apply the same trading strategy described in the previous posts across the full QQQ history, the answer is: yes, it still works, at least on paper.
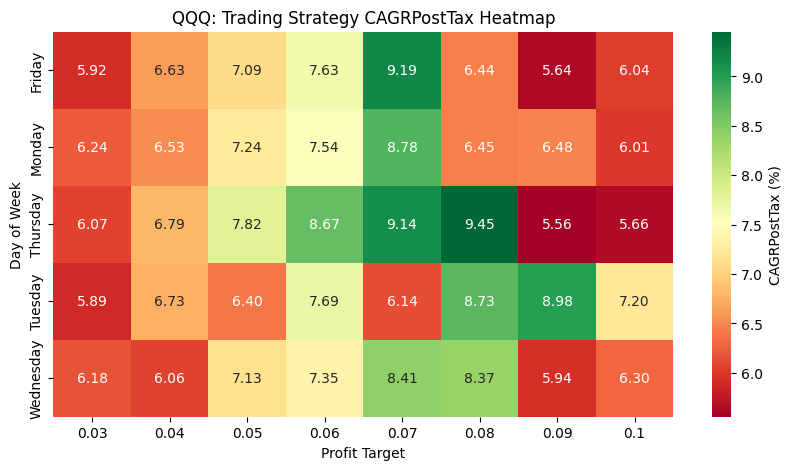
It works well enough to produce positive returns, but falls behind dollar cost averaging buy and hold, and barely ekes a win over Buy and Hold.
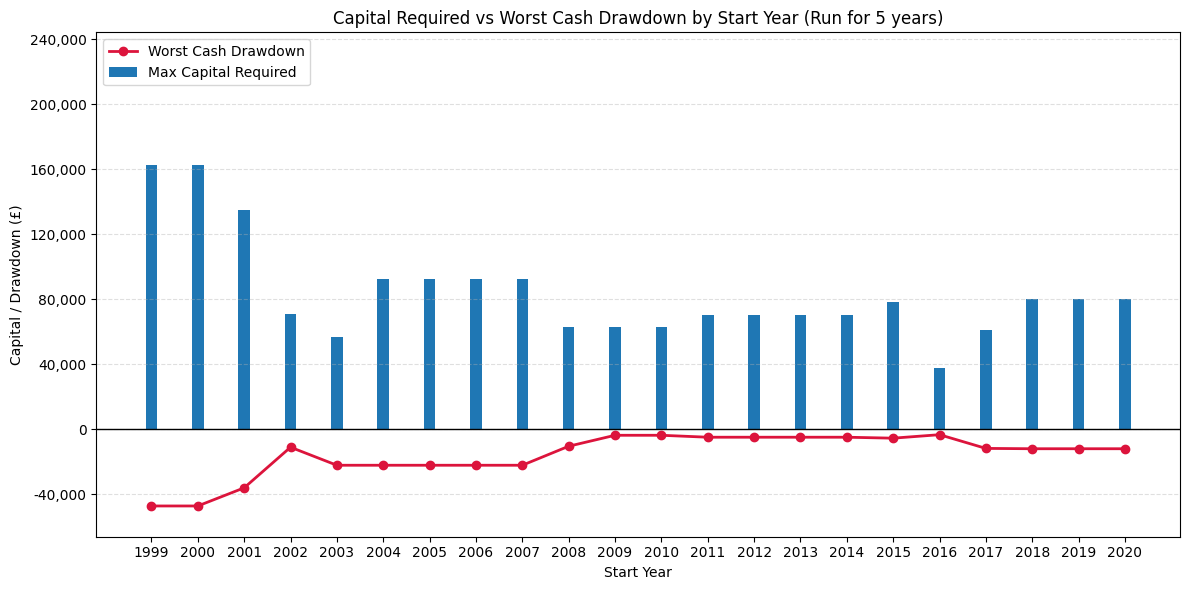
Returns alone are not the full story. Capital requirements matter. And this is where things start to get uncomfortable.
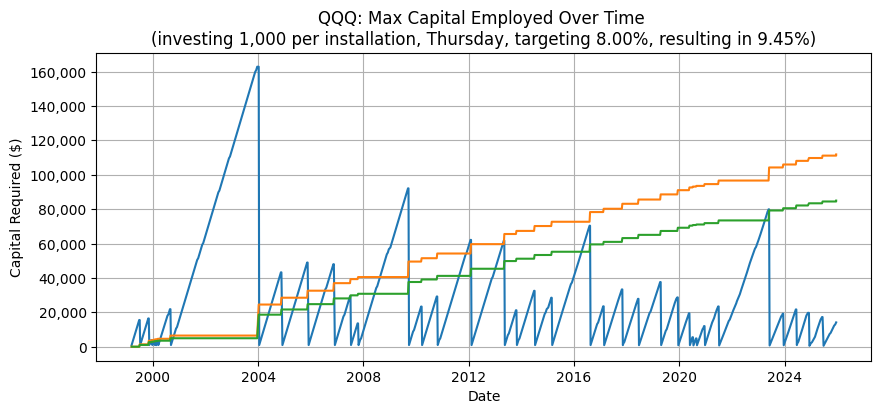
The maximum capital required peaks at around 160,000, off of a $1,000 investment each week! That represents more than three years of continuous weekly buying without ever hitting the profit threshold required to trigger a sale.
That number gave me pause.
It is one thing to say, in theory, “this strategy makes money.” It is another thing entirely to live through three years of adding capital every week without seeing a single realised profit. That requires a level of patience and conviction that most people, myself included, tend to overestimate.
My personal experience is that traders, unlike long-term investors, like to see progress. Even an occasional win helps maintain discipline. Going years without a realised gain is psychologically brutal, and in practice often leads to abandoning the strategy altogether, usually at the worst possible moment.
If trader behaviour is a key constraint, then time horizon becomes critical.
What If You Don’t Stick Around That Long?
Let’s look at what happens if the strategy is run over shorter windows, and explicitly account for drawdowns, both in absolute and percentage terms.
Two-Year Windows
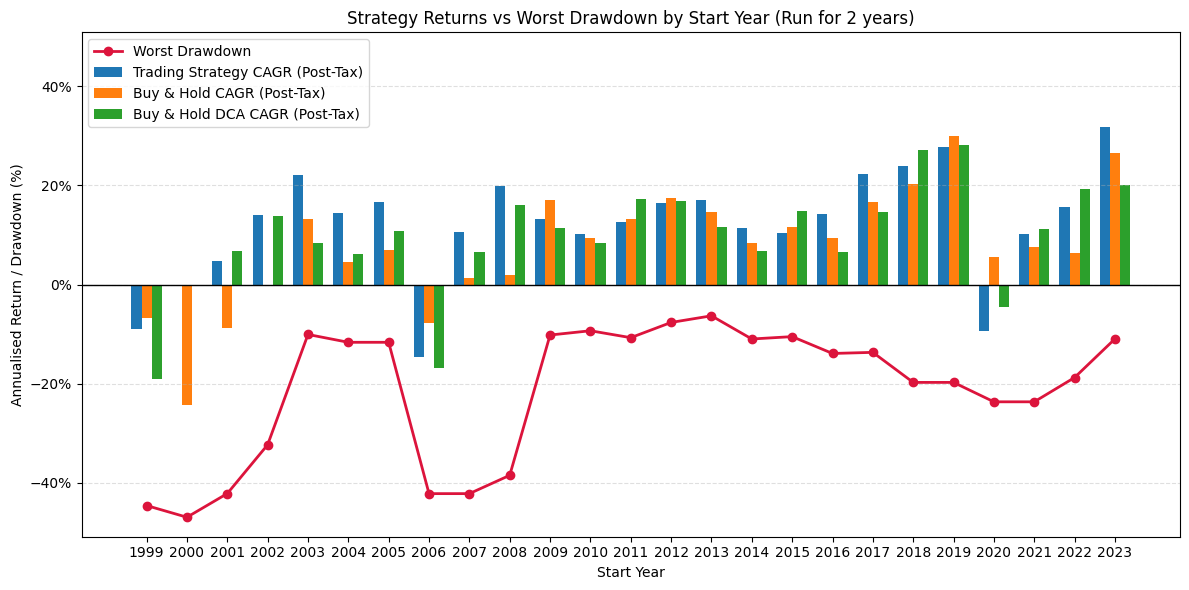
Depending on when you start, a two-year window can produce outright losses or significant underperformance versus simpler strategies. More importantly, the drawdowns can be severe. This is where the emotional cost of the strategy becomes most apparent. Being materially down for extended periods is not for the faint-hearted.
Three-Year Windows
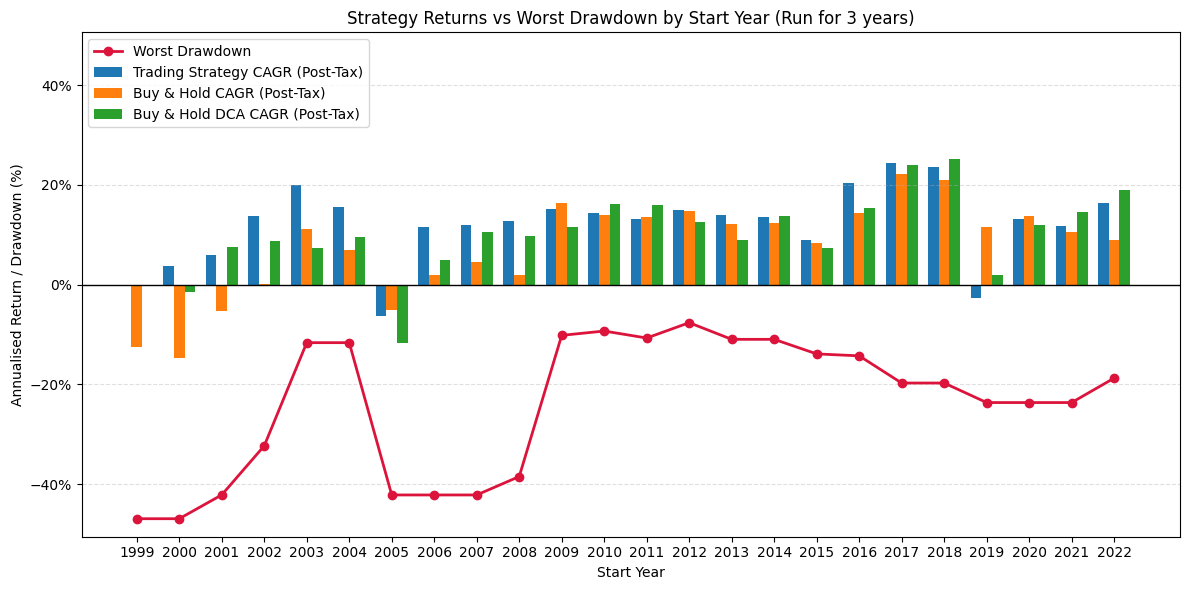
Extending the window to three years helps, but not by much. The number of losing periods drops, but they do not disappear. Drawdowns remain large, and patience is still very much tested.
Five-Year Windows
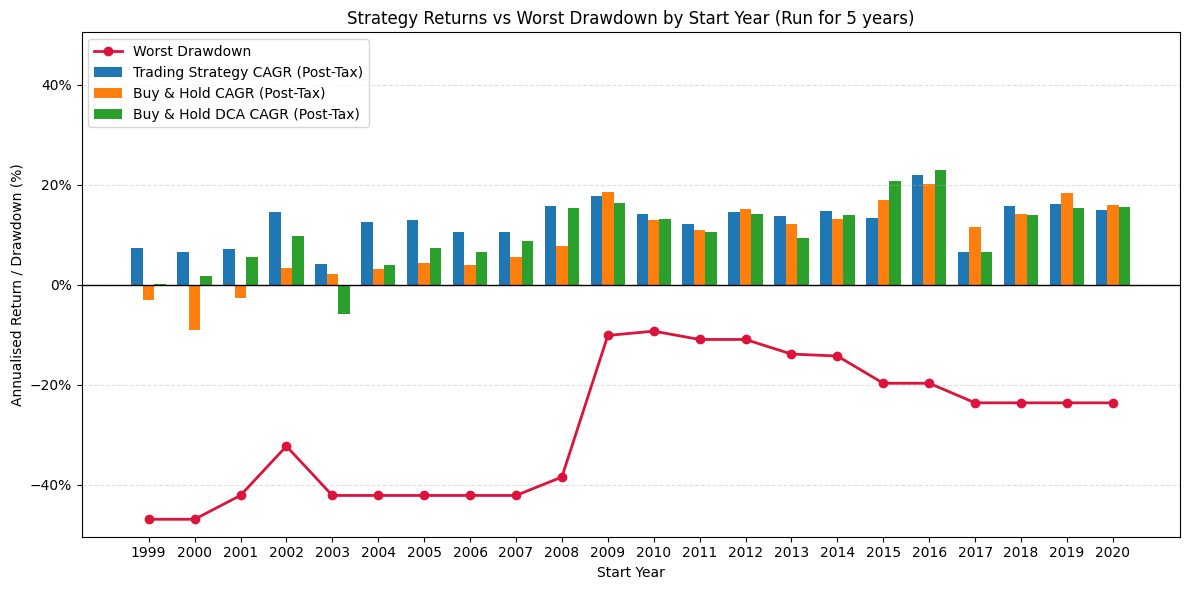
At five years, the picture finally stabilises. Losing periods disappear in this sample, and the strategy becomes more robust. However, the capital requirements and worst drawdowns remain substantial.
Catch the falling knife once, and you are committed for the duration, regardless of how long you intended to run the strategy.
So Where Does That Leave Us?
What initially looked like a clean, attractive strategy turns out to be far more demanding than recent history suggests. It requires more capital, more patience, and more emotional resilience than many traders are realistically prepared for.
To make this explicit, it helps to look at performance across a wide range of holding periods.
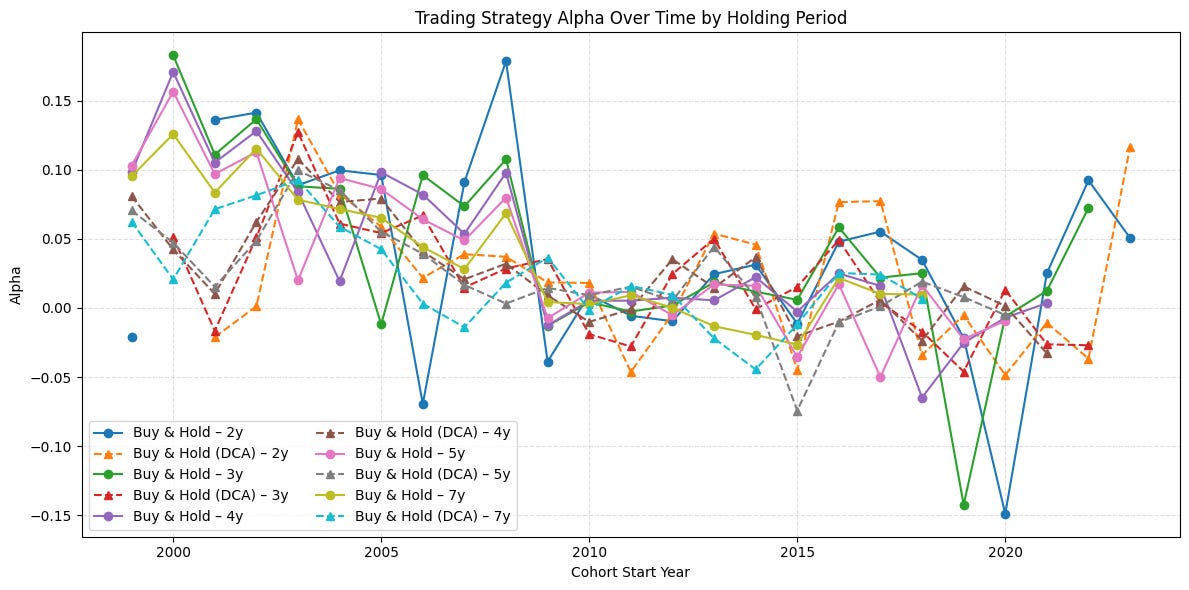
The chart is noisy, but the key question is simple: are the lines mostly above zero? If they are, the strategy might still make sense.
The answer is mixed. There is a positive skew, meaning the strategy often works. But there is also a non-trivial amount of time spent below zero. Add to this the fact that buy and hold returns are understated here due to dividends being excluded, and the more favourable tax treatment long-term holdings receive in many jurisdictions, and buy and hold starts to look very hard to beat.
Could QQQ Avoid Another 2000?
That is the real bet.
QQQ is quite concentrated, just 100 stocks, heavily skewed toward a single sector. If that sector comes under sustained pressure, the drawdowns can be brutal. If your belief is that such a scenario is unlikely during the period you plan to run this strategy, then volatility harvesting may still make sense.
If not, buy and hold remains a formidable default.
And perhaps that is the final lesson. Strategies do not fail only because of bad maths. They fail because humans struggle to stick with them through long, uncomfortable periods.
With that slightly sobering thought, happy investing.
Disclaimer: I am not your financial advisor and bear no fiduciary responsibility. This post is for educational and entertainment purposes only. Do your own due diligence before investing. I may hold or enter into positions in the securities mentioned above. This is not a solicitation to buy or sell any security.