
Some valuation thoughts
There is valuable to be found, just not where you want

If you are holding equity, then in the long run the value of the stock should generally move in the direction of the earnings. Earnings in turn is a result of two input variables - revenue and profit extraction. Earnings per share is also affected by the changes in the quantity of outstanding shares, going down when the company issues new shares and going up when the company buys back shares (or reduces it in some other ways like tenders etc).

Christopher Bloomstran wrote in his Semper Augustus annual letter about how these variables combine together to produce this formula.
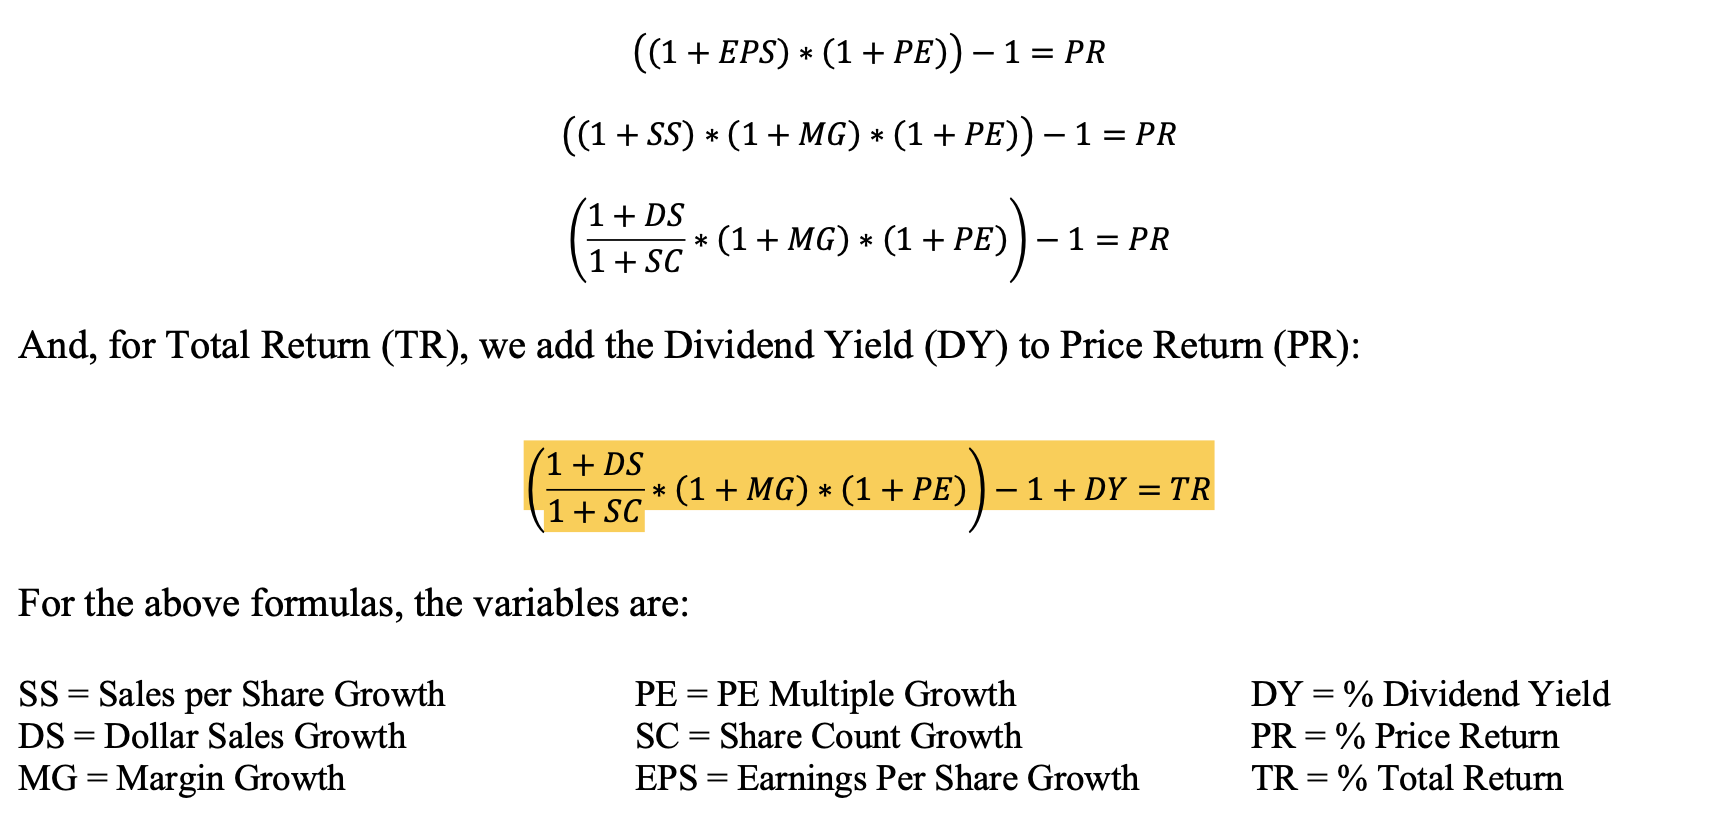
If you haven’t read through the document, it is a wonderful read. It is a dichotomous document that is interesting enough to tempt me into a single sitting reading, but so heavy in content, that I am forced to pause and digest the concepts and abstractions before proceeding on1. Strongly recommended. Find it here.
Coming back to the purpose of this post, I was inspired by his writings to analyse similar to how he does. For instance I already had SS, DS, MG (or could be derived from what I have), PE growth (to be calculated with time), and EPS growth. What I was missing is revenue per share and the share counts themselves. So I went back to all 48 of my holdings and added further metrics.
This post present some basic findings. The purpose of the post is to lay out the thinking and use it in due course of time to see how it changes with time2.
Overall Metrics
The following are metrics across the entire portfolio. For every £100 of investment, it produces:
£92 of sales (P/S of 1.09)
£6.5 of earnings (P/E of 15.43)
£2.52 of dividends (Dividend Yield of 2.52%)
10.81% of Revenue Growth (DS in the above formula)
This means that the portfolio of companies extract roughly 7.05% of their sales in after-tax earnings. In turn, these companies are willing to pay out roughly 39% of their after-tax earnings in dividends, while retaining the rest for reinvestment in the business.
Costliest Region - US
In the US, these numbers steeply rise. For every £100 of investment, it produces:
£47.2 of sales (P/S of 2.12)
£4.90 of earnings (P/E of 20.41)
£1.10 of dividends (Dividend Yield of 1.1%)
8% of Revenue Growth (DS in the above formula)
(India is likely to be marginally costlier, but since I am holding ETFs representing India, it is harder to compute it myself, so I am skipping calculating this for India, but suffice to say it is more likely to be close to US than any other region.)
Cheapest Region - China
In China, these numbers improve materially. For every £100 of investment, it produces:
£325 of sales (P/S of 0.31)
£11.4 of earnings (P/E of 8.78)
£4.05 of dividends (Dividend Yield of 4.05%)
27% of Revenue Growth (DS in the above formula)
Comparison to Relative Score
Interestingly, the companies that bring the best value (lowest P/S or highest revenue growth) correlate highly with the Relative Score I published a while back, and that makes general sense to me - the best value can be extracted by companies that are growing the most, relative to their price.
The top-10 companies with best relative value scores at the moment for instance are (best on top):
HKG:0914
HKG:0992
HKG:1099
HKG:0700
TSE:SJ
ASX:BKW
HKG:9999
LON:LGEN
HKG:9988
You see the trend here, right? 6 of the 10 companies are from China.
The bottom-10 companies by relative value scores are (worst at the bottom):
NASDAQ:MSFT
SWX:NOVN
NASDAQ:COST
NYSE:PG
NASDAQ:PEP
NYSE:MKC
NASDAQ:AMZN
ASX:IRE
NASDAQ:MDLZ
NYSE:DIS
Again, no surprises, 8 out of the 10 companies come from US.
Some Summary Thoughts
Dollar Sales and Revenue per Share are current metrics and not backward looking and should be taken seriously by investors. Profit extraction from sales is another metric whose trend is important to keep an eye. By those measures, China seems screamingly cheap now, which adds a bit of fuel to what I wrote 2 weeks back.
Is it worth betting my farm? Is this the opportunity of my lifetime? I am not sure and I am skeptical and so should you be. Metrics and numbers and valuations are great, but one must face the harsh reality of government structure in China and the risk it poses to ownership of assets, specially by investors overseas.
Does this mean US should be shelved altogether? Again the answer is I am not sure - US companies might be costly, but they have also proven to be one resilient set of companies, with market actors being the most efficient at extracting value from the business opportunities. There might be some temporary setbacks, but US companies are likely to still produce long term value, or so I believe.
The way I am playing this is by temporary increasing my buying in China, but offsetting it by buying just about enough of other things that my allocation doesn’t tilt too far towards that region, and then just wait and see what happens. If I prove right in my assessments, it will add decent alpha. If my risks turn out to be true, I wouldn’t have lost my shirt.
Its tricky. It always is.
(Disclaimer: Nothing written here is a solicitation to buy the stocks mentioned. I hold position in all the stocks mentioned in this post)
I haven’t completed it yet.
All the metrics presented below are based on the purchase price basis. These metrics are obviously impacted by changes in market price of the securities (M2M), so when the stock price grows, these metrics worsen and vice versa. But thinking of it on the basis of purchase price - i.e. when decision is to be taken, is useful.