
Scoring & Weighting my Coffee Can Portfolio
Using a collection of metrics to score how each business is performing

As Coffee Can Investors we want to be buying and holding slices of wonderful business over long periods of time. However, what is a wonderful business? Some definition of “wonderful” likely includes subjective attributes - the industry that a company operates in, the quality and culture of the management, the brand that the company enjoys, the relationship with clients and suppliers, regulatory support and so on. These can’t be “measured”, they can at best be described and we as investors need to take a call based on what we learn.
It's far better to buy a wonderful company at a fair price than a fair company at a wonderful price. - Warren Buffett
However, other parts of the business can be measured - revenue growth, margin extraction, whether share counts are decreasing or increasing, company’s attitudes towards capital allocation including dividends and buybacks and so on and so forth. These can be measured and recorded and observed over long periods of time. The hope is that over long periods of time, these metrics collectively also tell us something about the intangibles of a wonderful business. i.e. a retailer that continues to expand over 10-15 years, is very likely to have the ability to provide good quality produce to its customers, while maintaining healthy relations with their suppliers.

Over the past 2 months or so, I have been looking to record 15 data points about every company in my coffee can portfolio, over 15 years (or less where the company has been around for less) and tried to come up with a scoring system for the quality of the businesses that are in the portfolio.
These 15 data points are:
From the Balance Sheet:
Latest Current Ratio
Latest Total Ratio
Track Record (all measured over 15 years)
Number of years of increasing dividend
Number of years of increasing revenue
Number of years of increasing diluted EPS
Consistency1
Length of observation (in years, max 15)
Percentage of years when PBT drops by more than 10%
Percentage of years when PBT drop by 50%
Terminal PBT over original PBT
P&L / Dividends
Length of observation (in years, max 15)
CAGR of Revenue
CAGR of OPAT
CAGR of Diluted EPS
CAGR of Dividend growth
CAGR of Average Share Price
(There is some overlap between the data points - for instance the length of observation in the 3rd and 4th buckets are almost always the same. Similarly a company with a good track record will most likely have high consistency score metrics.)
In some cases, I have made some minor adjustments - for instance, for a business that had recently discontinued operations, I have added it back to get an accurate picture of business and management performance. For Berkshire Hathaway, these measurements are only on the operating businesses, and the marketable securities portfolio has been entirely taken out.
Based on these 15 data points, I have scored every company in my portfolio and call this Business Value Score2. The lowest score was 1.21 (Challenger Financial, ASX:CGF), the highest 63.05 (Tencent Holdings, HKG:0700), the median is 13.72 (UCB SA, EBR:UCB; Fresenius Se, ETR:FRE) and the average is 17.80.
To showcase the differences in metrics, see the input scores for these companies and the output score:
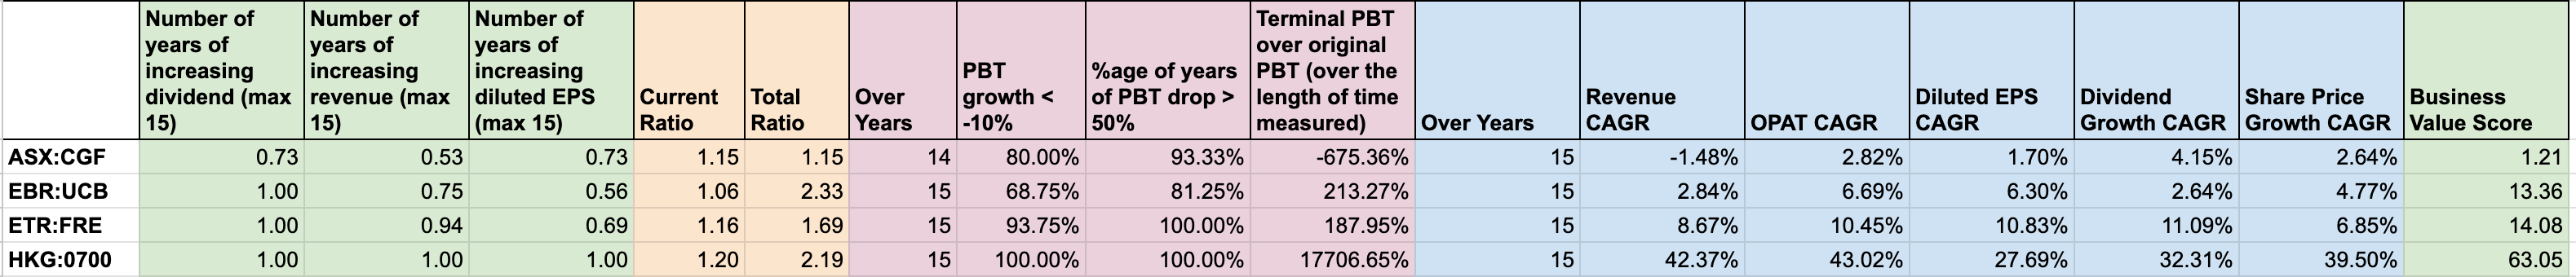
CGF’s PBT has declined over the past 14 years, its revenue is going backwards over long periods of time, and share price is going nowhere. On the other hand, Tencent has grown it’s PBT 17x in 15 years, Revenue is chugging along at 42% growth for long periods of time, and its share price is following along.
Companies with weak Business Value Score
Companies with a score of 5.5 or less are facing significant business challenges and the metrics are showing that they aren’t doing all that well, over the medium term. I will not be looking to add to my positions in these companies and wait to see if they recover from their weakness, marking them as “Dilute”. In true coffee can investing style, I will not be looking to sell any positions. The list:
ASX:CGF - Challenger Financial
ASX:IRE - Iress Ltd.
BME:ENG - Enagas
HKG:9618 - JD.com
NASDAQ:MDLZ - Mondolez
NASDAQ:PETS - Petmed Express
NYSE:DIS - Disney
NYSE:MMM - 3M
NYSE:PG - Procter & Gamble
Over time I expect these stocks to form a smaller and smaller portion of my portfolio, while I retain the optionality of seeing some upside if these businesses turn around3. Never investors might be better off not starting off positions in any of them right away.
Weights in the Portfolio

In fact, the scores allowed me to also identify ideal weights - I bucket all the companies in 4 buckets - with score thresholds being 5.5, 15, 25. Companies in higher buckets can then be assigned a higher weightage than the ones in lower buckets. The weights I use are 0.85%, 1.24%, 2%, 3.8% (roughly doubling at each step, but adding up to 100% across all tickers). The 9 challenging businesses above, for instance, won’t make up much more than 8% of my portfolio when I am done diluting their positions down.
Valuations
Just measuring the quality of the business isn’t enough for us to make decisions on what to buy and what not. We also need to consider Valuations. We want to be buying stocks that are reasonably priced. Now that I had a score for each business, I normalised that and converted them into “Expected P/E”. In the exercise, I am determining that a business with a score of say 5 is still worth buying if it is very cheap - say 5x PE, but no business is worth buying over 30x P/E.
By normalising the scores into expected P/E, the job of understanding what stocks are attractively valued or not becomes rather simple - you subtract the actual P/E from the Expected P/E (and normalise it for the distribution). I call this “Relative Score”. If the relative score is positive, then the company is worth buying today.
Too Costly
By that measure a small number of companies are marked as too costly for accumulation at current prices. I have marked them as “Maintain” - i.e. I might maintain my position till they cheaper and/or the business score catches up with the pricing. The list:
NASDAQ:AMZN - Amazon
NASDAQ:COST - Costco
NASDAQ:PEP - Pepsico
NYSE:MKC - McCormick
It is likely that some investors might find value in buying these stocks even at these price points, as they might expect higher growth or better profit extraction, specifically in case of Amazon, but I leave that to the reader to decide.
Summary
This then brings us to the generally good news. 37 tickers in the coffee can portfolio not only have good business scores, but have positive relative score, and are marked as “Accumulate”.
The final weights and the Status (Accumulate, Maintain and Dilute) have now been added to the Shreeni’s Coffee Can Portfolio sheet. As always, this post and the data provided in the sheet is primarily to journal my own thinking, while sharing my framework around investing. This is not meant to be prescriptive in any manner. While you are free to use these columns in the sheet, I would suggest thinking about something similar for your own investing journey.
Do you have a similar framework? Would you like to share it on this substack?
I am very aware that there are a few loose ends with this post - for instance, the exact formula for the BVS and the details of companies marked under Dilute or Maintain. I am hoping to come back to them in future posts.
Consistency in business performance matters a lot - read https://www.motilaloswal.com/site/rreports/HTML/638064288139494947/index.htm
I would love to write more about the formulae I use, but in order not to distract ourselves from the core goal of identifying key outcomes, I am skimming past it. In the a future post I plan to come back and write about the formula itself.
Each of these businesses are different in the ways they are challenged. I would like to write more about what I have observed on the metrics, but that will have to wait for other posts. The point is that there is a non-zero chance that some, if not many of these will turn around and give acceptable returns. However, we should play the game based on what we see today.
Great work. Although all very backword looking. In the end price would be determined by future developments and while past provides some gudiance to it, the predictive value is very small in my opinion.