
From Dominance to Dilemma: The US Equity Puzzle
Evaluating the S&P 500's Incredible Run and the Risks of Betting on the Future

Welcome back to the blog and wishing you all a prosperous and profitable 2025! In my previous post, I mentioned that the US has been the best-performing geography in my entire portfolio—across both my coffee can holdings and otherwise. No surprises there.
The US has been on a rip-roaring streak. Since January 1, 2013, the S&P 500 has returned a staggering 12.52% annualized, excluding dividends, and an even juicier 14.52% when you include them. Adjusted for inflation, that’s 11.54% per year. Incredible. This run has been powered by tech’s meteoric rise—phases driven by Search, the Mobile App Economy, the Cloud transition, Big Data, and now AI. And it all stems from just a few hundred square kilometers in the Bay Area. Calling it remarkable feels like an understatement.
That said, I’m starting to feel a tinge of unease. No, I’m not predicting a bubble or a tech implosion—those are debates for stronger opinions. But valuations are undeniably high, and history suggests that outsized past returns often set the stage for more modest future ones.
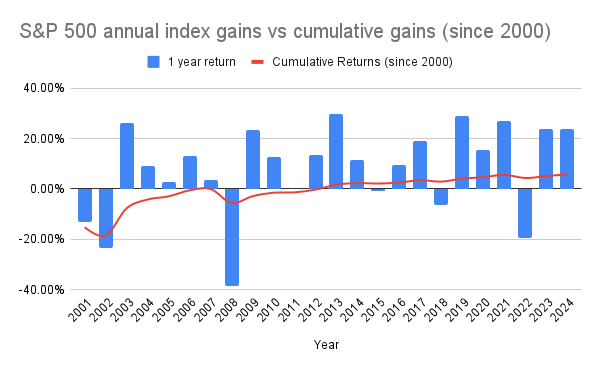
Take a look at this: here’s a graph of calendar-year returns plotted against the long-running cumulative annualized capital gains since 2000. The turn of the century marked the peak of the dot-com bubble, followed by years of pain. The first two years of the new millennium were deeply unprofitable, and by the end of 2006, the index was essentially back to where it was in mid-2000. That’s six and a half years of going nowhere, excluding dividends. Then came the subprime crisis, slicing the index by more than a third. Only after 2012 did the S&P 500 truly hit its stride, delivering breathtaking advances year after year.
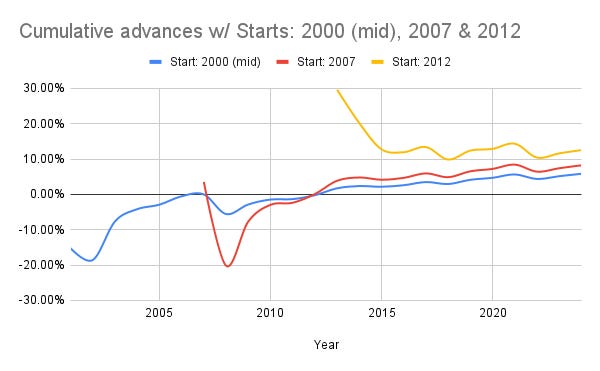
Here’s another graph with modified start dates to make this clearer.
So, yes, I’m a little concerned.
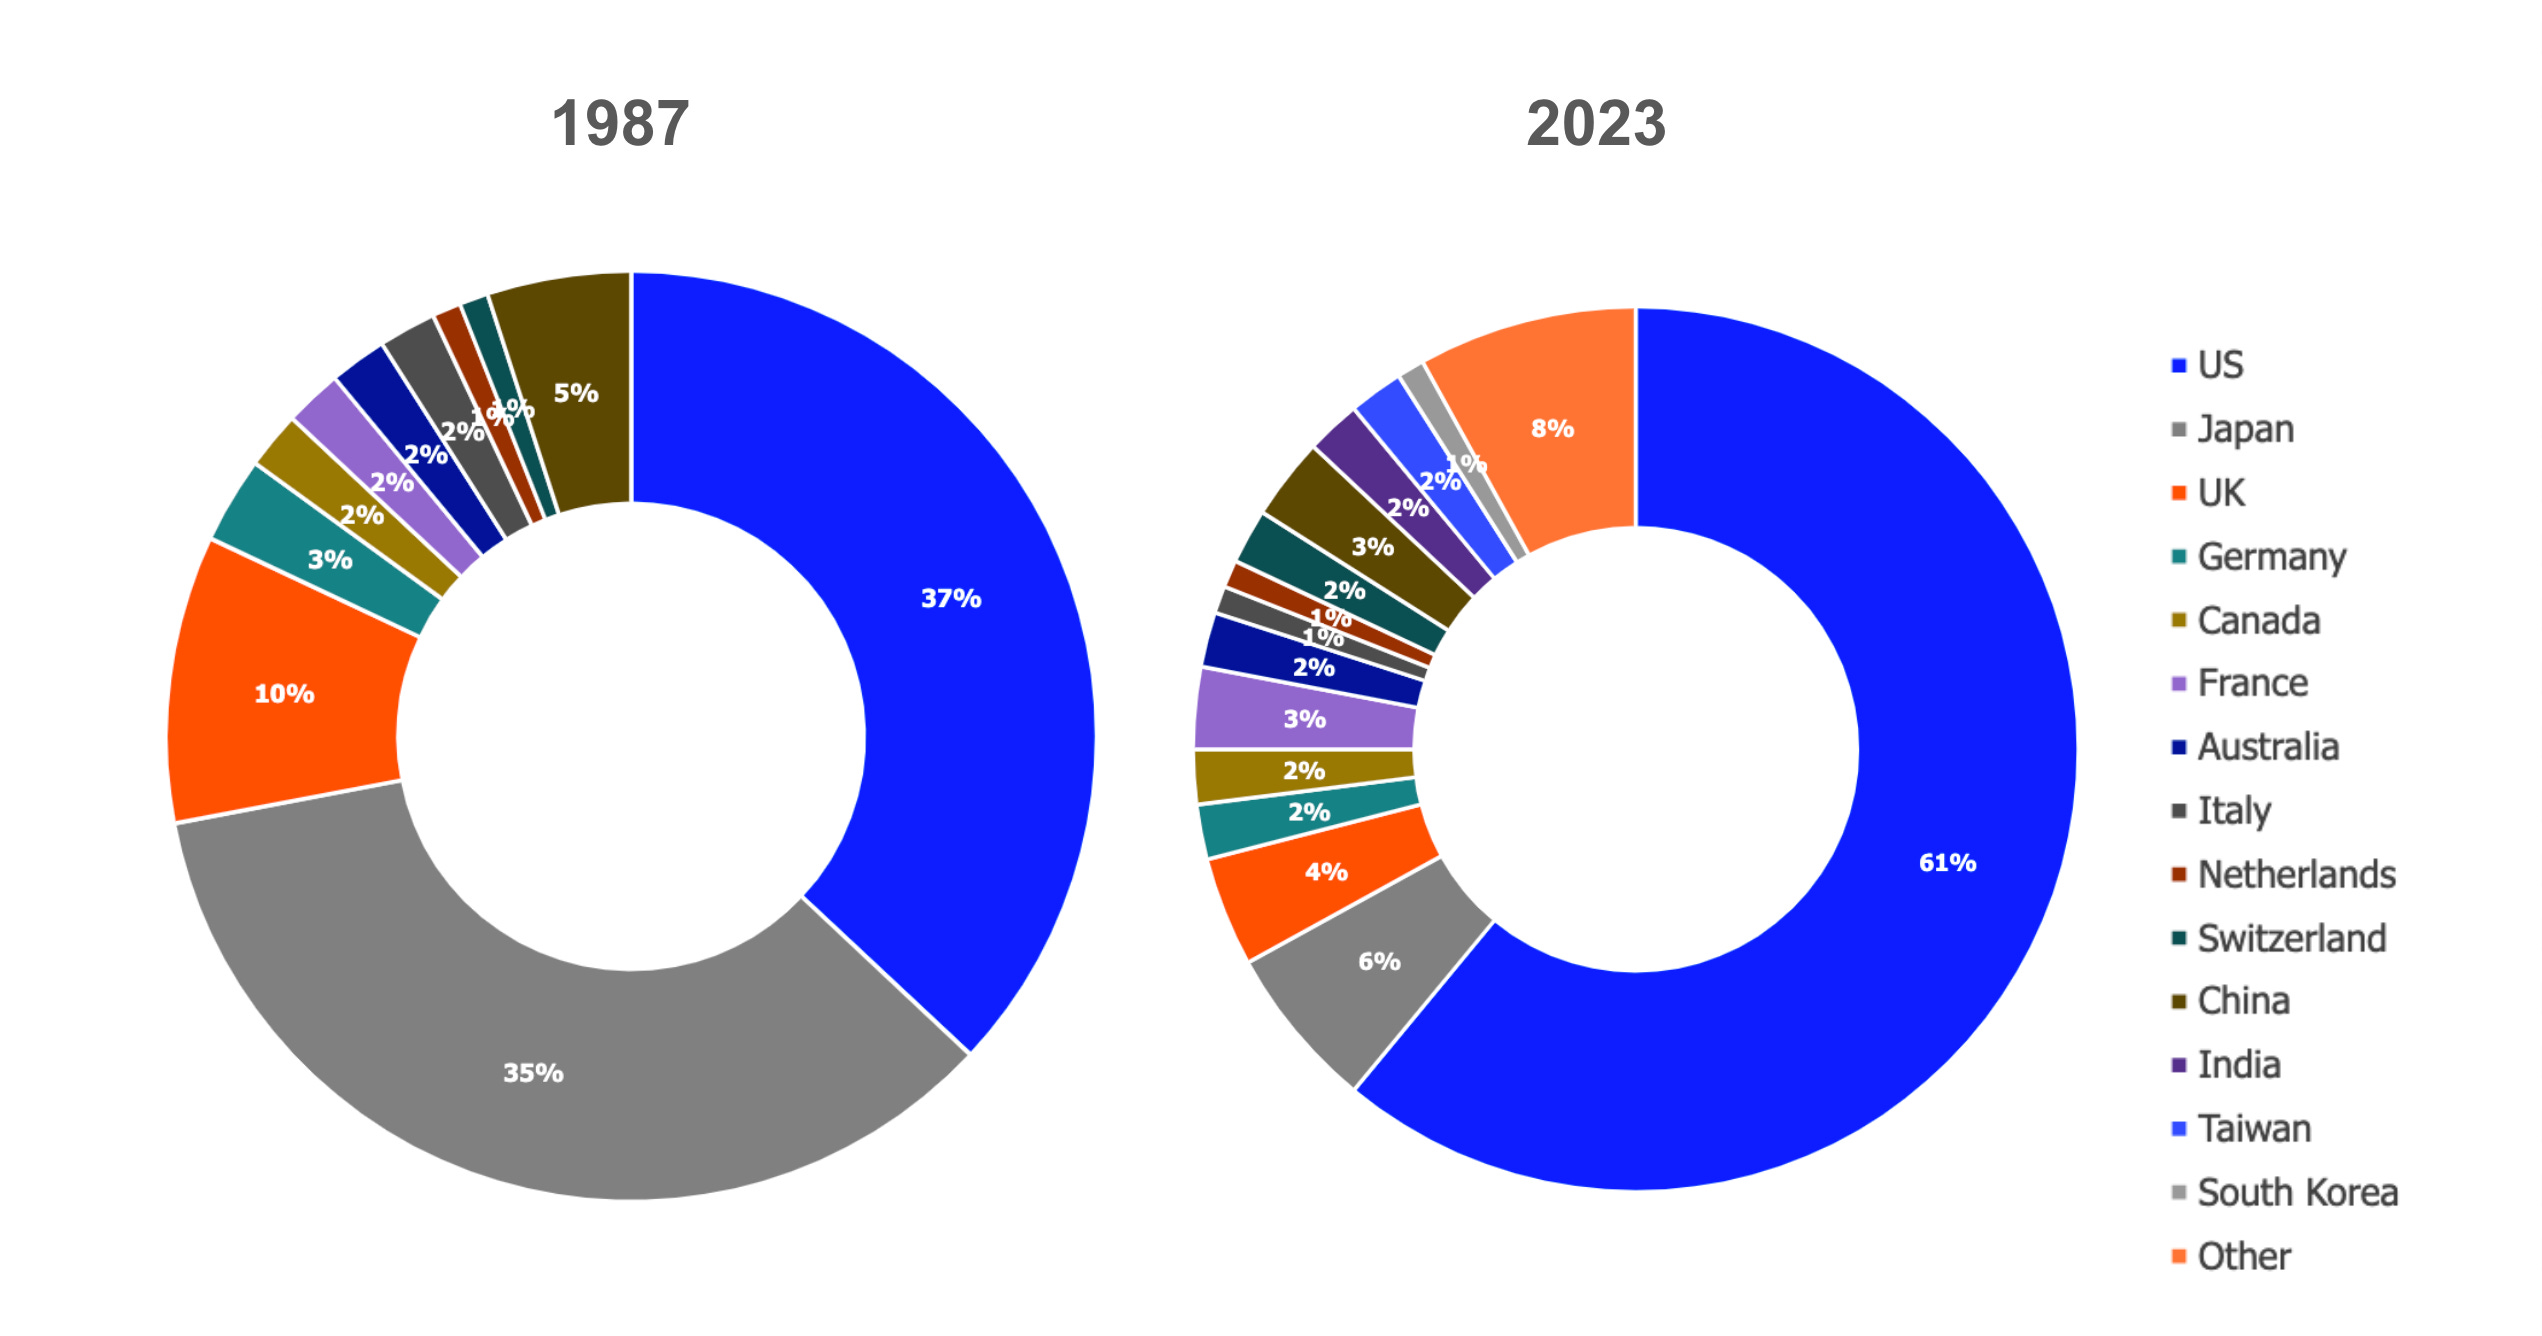
What’s even more telling is the US’s growing dominance in global equities. In 1987, US equities made up just 37% of the global market. Today, they’re approaching 68%. Much of this dominance is well-earned—the US boasts a resilient economy and attracts equity listings from around the world. The UK, for instance, has been losing listings to the US at an alarming rate.
But here’s the big question: how much further can this go? What happens when there’s no more pie to take? And while this isn’t a political blog, could geopolitics play a role?
Whether the future mirrors the sluggish grind of 2000-2012 or the spectacular rally of 2012-2024 is anyone’s guess—and the answer will have a huge bearing on our financial futures. If we’re heading into a period of flat or modest growth like the early 2000s, the drag on long-term returns could be significant, particularly for those with heavy exposure to US equities. On the other hand, if we’re in for another decade of relentless innovation and market gains, sitting out could prove incredibly costly.

This divergence—between a period of consolidation and another runaway success story—has far-reaching implications. With global equity indexes now 68% weighted toward the US, the stakes are higher than ever. That dominance means the upside could be enormous if the US continues its streak, but it also means the downside risk is magnified. Put simply, we’re all more leveraged to what happens next—and how this plays out will likely define our financial trajectories for years to come.
For now, I’ve significantly trimmed my direct US holdings. I’ve been offloading a large S&P 500 index position over the past few months. That doesn’t mean I’m out for good—I plan to dollar-cost-average my way back in, albeit more selectively. Instead of broad index exposure, I’ll likely focus on standout opportunities. Companies like Berkshire Hathaway remain core holdings, and I’d gladly add more there.
Of course, the market could make a fool of me. Another 20% run-up this year would prove me wrong. But I’m okay with giving up a little upside to protect against potential downside.