
Calculating Portfolio Returns and Snapshot Performance Review
Getting your comparison Apples to Apples and placing them in context is vital

Its been 3 months since I started this substack - I hope you found as much joy in reading the content as I had in putting this together. Let’s quickly recap the last 3 months.
In Jan, I introduced you to Coffee Can Investing, writing a Thorough Introduction, and then about the Principles of Coffee Can Portfolio selection. In Feb, I shared my own Coffee Can Portfolio (most read post of the quarter), summary analyses on Sumitomo Corporation, Bunzl, and Mastercard. In March, after writing about Berkshire Hathaway (my biggest holding at the moment); about Ways of Losing Capital; about a Methodology of Scoring and Weighting my portfolio, and Updates on Some Companies based on their annual results. If you have recently joined this substack, I hope you find a reason to go through the archive.

Today’s post is going to be about portfolio performance, or to be precise, how to calculate it correctly, for amateur investors like us. (If you are a professional investor, or have graduated to the point of precisely calculating portfolio returns, then I suggest you skim through the post.) At the end of the post, I will also share the performance of my own portfolio.
The basics
Let’s say you have invested $100 and your portfolio today is valued at $150, a good 50% better off today than the day you invested, then that’s a good thing, right? Not necessarily. We have 2 parts missing at this point to make any judgments at all. First is how long have you been invested in this portfolio. Is it a day (wowza - take my money), a month (brilliant), a year (awesome), 3 years (ok-ok) or 10 years (pretty poor returns)?
Even those subtexts (brilliant, awesome etc) I have added are incorrect, so I will admit, as we haven’t still discussed the second ingredient - benchmark. All returns should be compared to what would have happened if this money were to be deployed somewhere else. Professional investors must identify a selection of securities to compare themselves to. However, it has to be truly comparative.
If you hold bitcoin, then comparing the returns to treasuries (or Government bonds, Gilts etc) is an insanely incorrect comparison, for example. Comparisons should be roughly to whatever you think is reasonably reflective of what you think your portfolio closely resembles, or aspires to resemble or outperform.
So, to get a reasonable judgement of how well a portfolio has performed (or is performing), you should
include timeframes
calculate returns based on timeframes
compare your returns to a reasonable benchmark
Let’s take the previous example, and add some details to it - you invested $100 3 years ago, in a selection of US based stocks, roughly reflective of S&P 500.
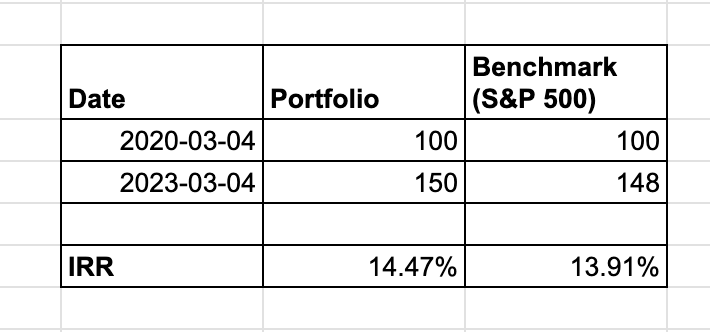
Portfolio returns are (a) 14%+ which is good, and (b) better than the benchmark. So, the portfolio has done well.
You can do this yourself at home - fill up the inputs (dates and amounts) and use the XIRR formula (in Google Sheets or Excel) and you are set.
About IRR / XIRR
The formula XIRR calculates Internal Rate of Return (IRR, and hence the name XIRR), and produces a number that tells how much returns a set of cash flows produced, on a percentage per year basis. Because it is per year, the elegance of this output is that it is a standard measurement of return and can be instantly compared to the IRR for another set of investments1.
Multiple investments
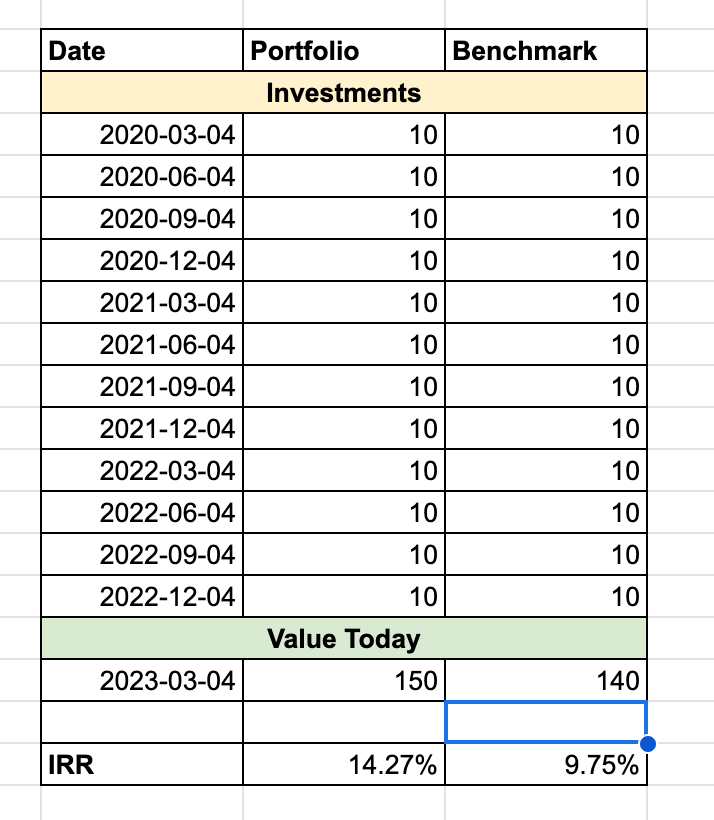
In case of most investors like us, we don’t do a one time investment and forget about it. We perform multiple investments. So, our cash flows are split over multiple time periods. Thankfully, the XIRR formula duly works even in that case, things look a bit like this (assuming investments every quarter):
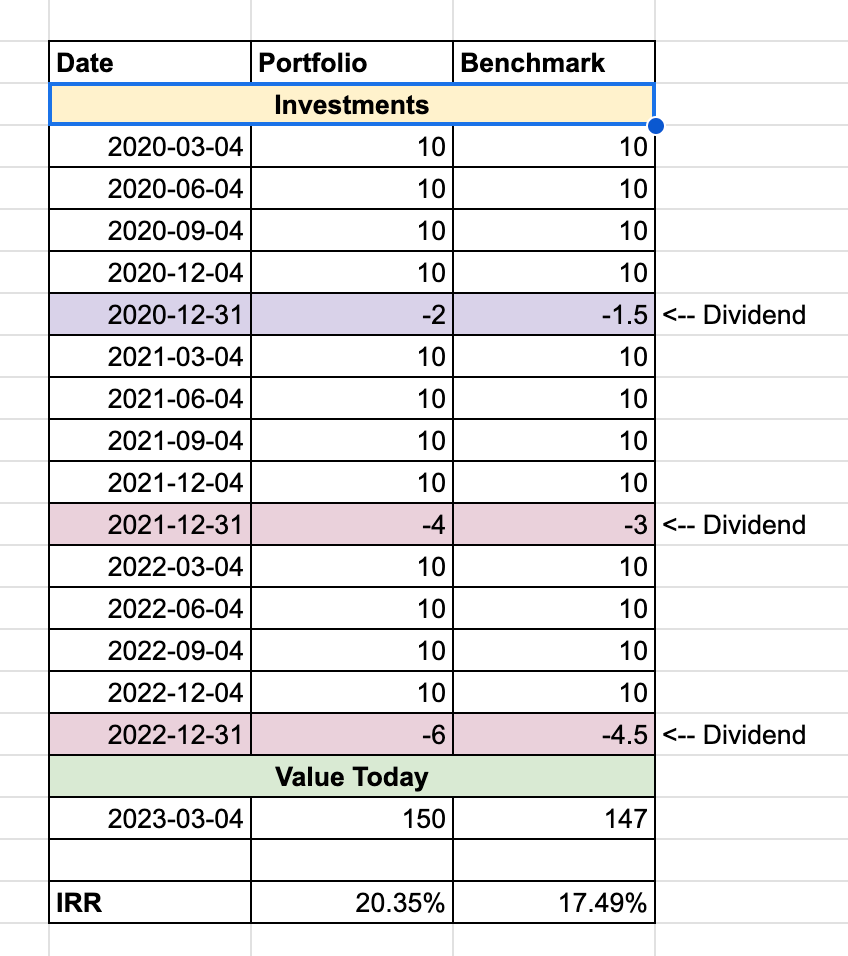
Even this scenario is super simple. In real life, we also have dividends being sent to us, which makes our tables look a bit like what’s presented below and thankfully, the XIRR formula will continue to produce the right rate of returns.
Selling assets will produce similar cashflows as a dividend - it will be a negative cash flow and should be treated accordingly. I am hoping that as coffee can investors, we won’t be partaking in those transactions for a very long time.
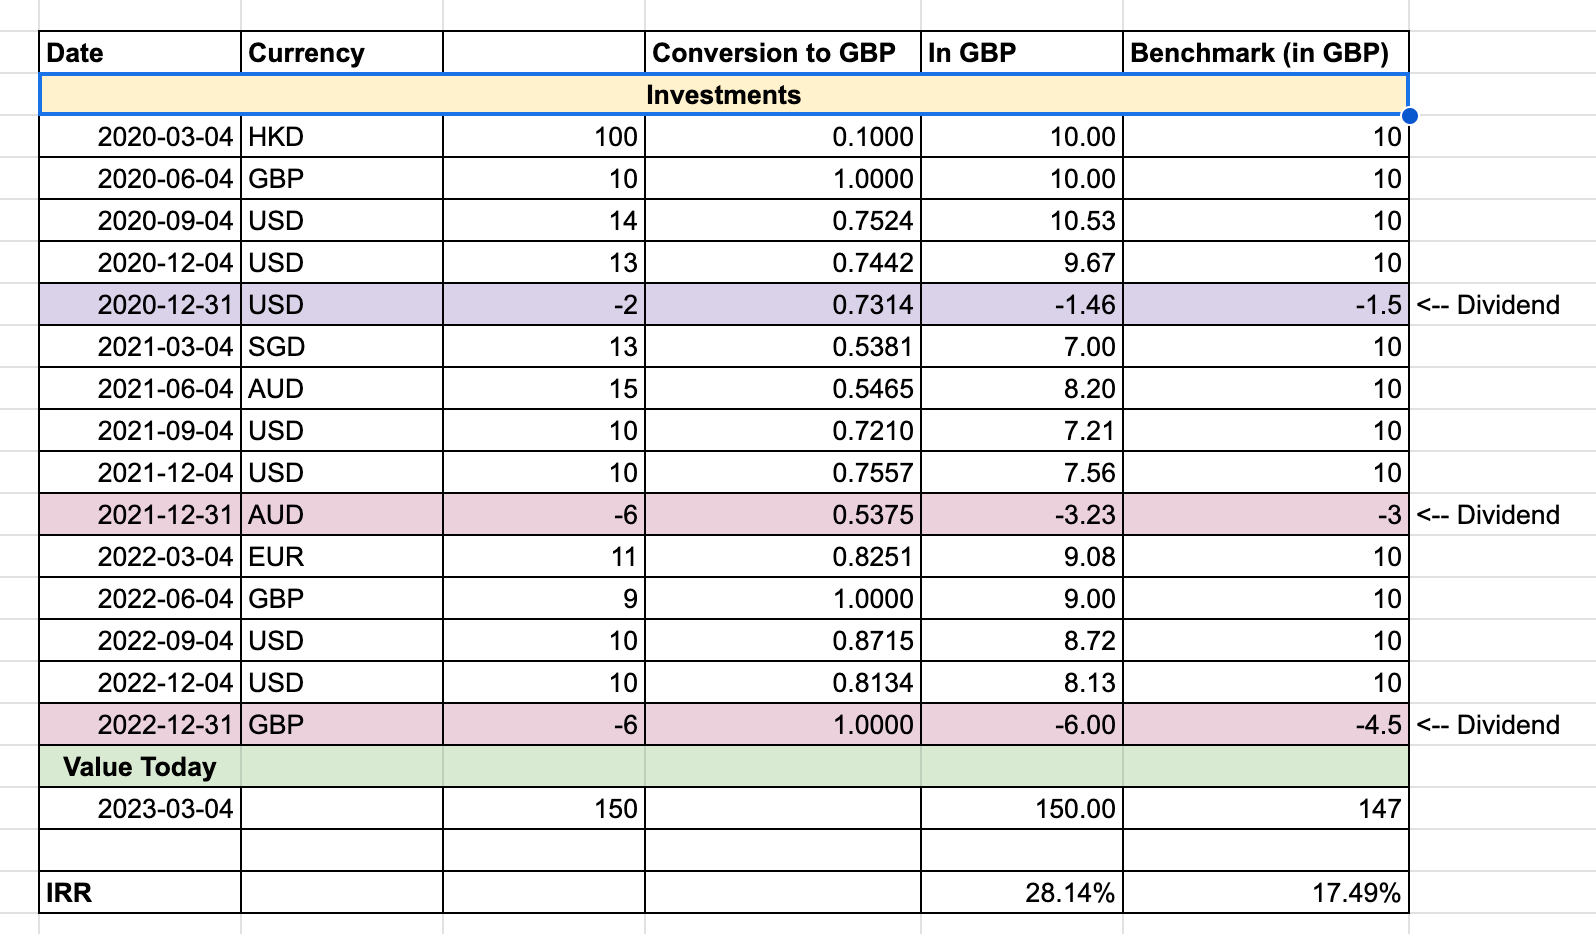
Multiple Currencies
So far so good. What about investments in multiple currencies? You need to pick a single currency to convert all your cashflows into, and then use that currency for all calculations. In general, it makes sense to pick the currency of your benchmark to convert into, but you can obviously choose something else, and then convert all transactions into that currency. All currency conversions should be done on the rate prevalent on the date of the transactions.
Simulating Benchmark Returns
In the above calculation we are assuming that you invested the same amount of money in the benchmark and you have a net portfolio value from those investments to slot into the right hand column of the above table. That’s not practical in real life. You need to be able to simulate what would have happened if you had invested the same amounts in the benchmark.
To do so, you need to convert the cash flows into equivalent flows into the benchmark. A bit like this:
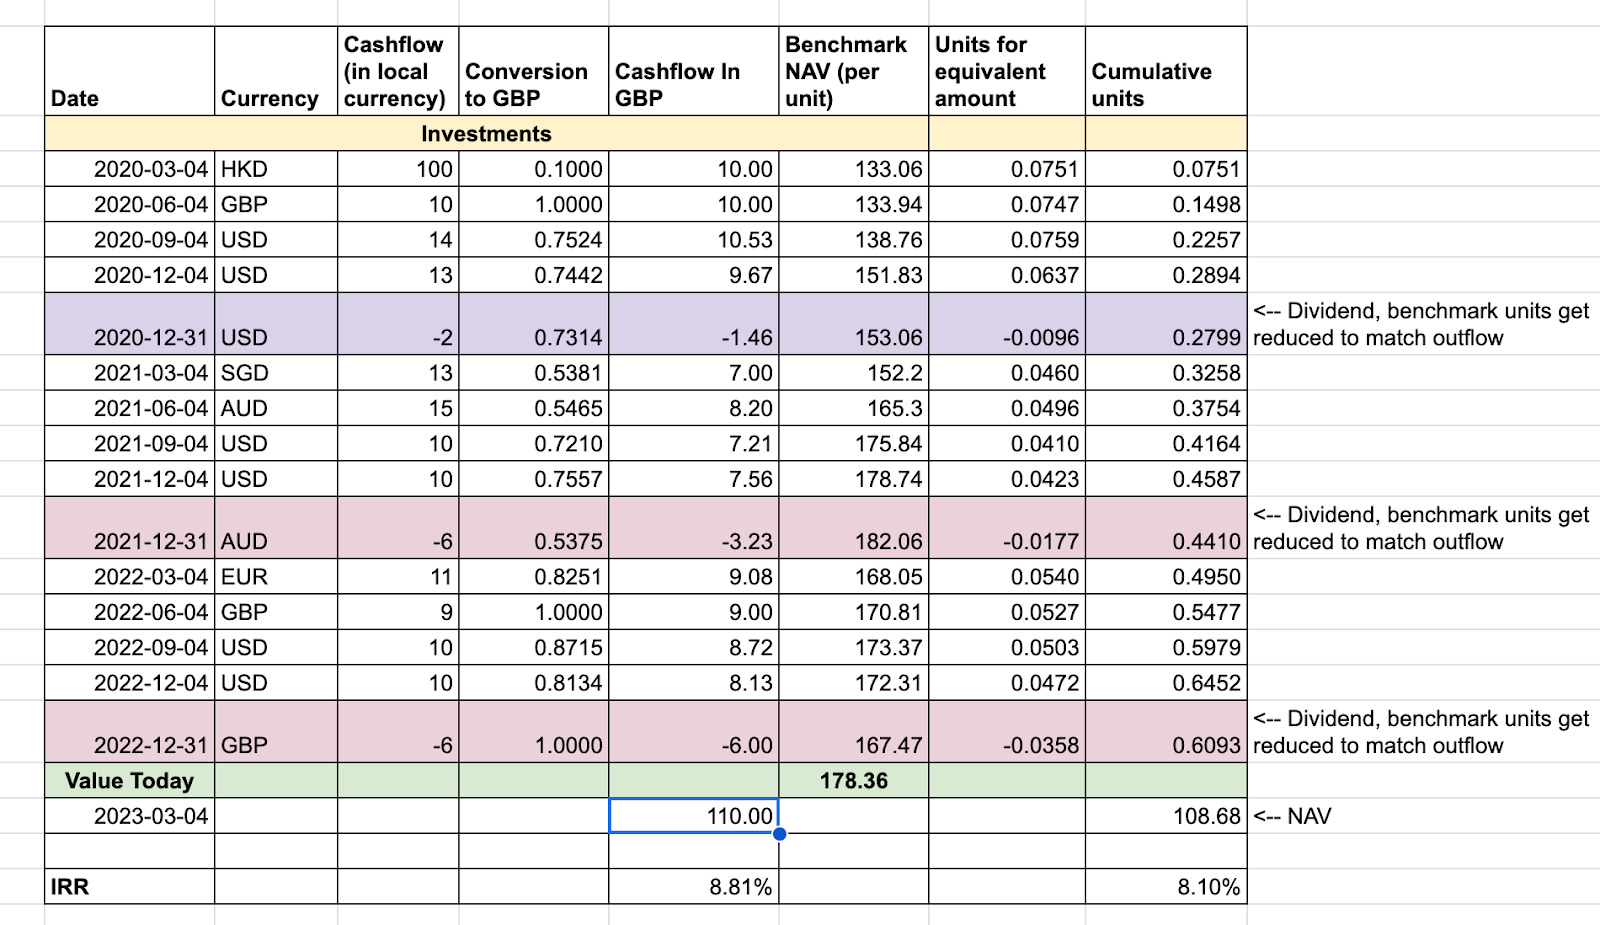
You need to have a mapping from date to the price/NAV of the benchmark. In some cases, you can get historical data through Googlefinance formula in Google Sheets, but in other cases you might have to download it from some public source and use that to arrive at the date based NAV. I have done the latter, using Vanguard’s FTSE All World All Cap Index Fund as my benchmark.
Shortcomings
The above approach does not factor in idle cash. For instance, any cash holdings that go in from your bank account into your investment account waiting to be deployed should ideally be factored into any comparisons. In a rising market, the cash that is not deployed reduces your return, and in a declining market, the opposite happens. I have not factored that in this tutorial - I am leaving it as homework to the reader.
Performance Analysis of my Coffee Can Portfolio
On the basis of the same calculations, my Coffee Can Portfolio is currently doing an IRR of 4.70%, as against 4.34% of the benchmark, which is Vanguard’s FTSE All World All Cap Index Fund, all measured on GBP basis2. I use this benchmark because it is reflective of a globally diversified portfolio that I aspire to in my own portfolio, and hence I believe it is pretty apples to apples.
4.70% might seem low, but 60% of the investments happened between 2021 (second half) and 2022 (first half) which was the secular peak in the current cycle. Performance is being tempered by the fact that I have likely bought a good portion of my current holdings at the top. This should, however, not bother us as long term investors, as over time, we will get the opportunity to buy the same stocks at multiple price points (phenomenon also called dollar cost averaging) and our portfolio businesses will also improve as the shadows of the current economic crisis are lifted. You can see that despite a rather moderating return, it is still better than the benchmark by a small margin. This indicates that portfolio selection is largely in the right ballpark. Over time I am hoping that both the IRR and the outperformance over the benchmark significantly improves with time. 🤞
(For context, over the past 12 years, my portfolio returns, which include everything from before the commencement of the current Coffee Can Portfolio cycle, is at 10.16% while the benchmark has done 9.10%. My portfolio have traditionally been very similar to my current Coffee Can Portfolio, so I am confident similar returns can be achieved in time).
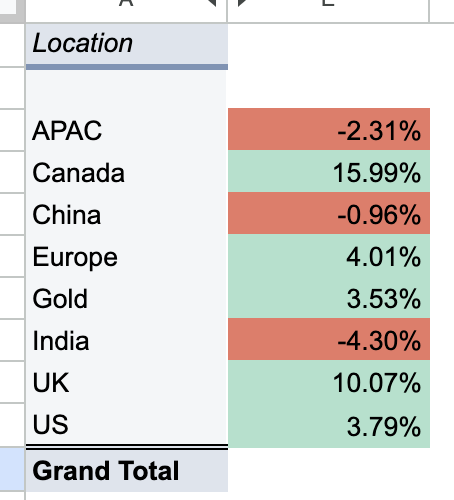
In terms of other nuances, India, APAC and China are all drags on the portfolio at the moment, while Canada and UK are really pulling the returns forward. (Chinese positions have had a good rally the past few weeks - before that, things were a lot worse in that basket)
Summary
Calculating portfolio performance is all about getting the cashflows right, putting them in context of time, and then comparing IRRs with the alternative opportunities. Current portfolio is doing about 4.7% (+0.36% v benchmark), and I am hoping it will trend upwards in due course of time.
All screenshots provided are lifted from this sheet, which you are free to use for your own purposes, after creating a copy.
That said, IRR does not compare risk, so while you will be able to compare bitcoin to treasuries and get a feel of comparative returns, you should likely do a proper risk adjusted return calculation to get alpha (which is the appropriate measure of risk adjusted returns between two investments) - I am not going to go into that for this post. Suffice to say that so long as you are comparing apples to apples, such as when comparing a portfolio to its benchmark, IRR comparison is well and good.
While calculating my portfolio performance, I am calculating it net of dividend withholding taxes, which can be substantial (0-35% depending on country where the company is HQed), but I am taking the benchmark returns gross of all taxes. This slightly depresses my portfolio’s returns (perhaps by 0.1% p.a. or so), but I am happy to keep it that way, since it is an essential cost of investing on our own, which is avoided when invested through the fund. I am not clear how much do funds pay in withholding taxes on dividends and it is likely dependent on the domicile of the fund and the domicile country’s tax treatments with other countries. However, whatever their tax treatment might it, it should be reflected into the NAV of the fund, which is what I take. So I consider this apples to apples.
ps: I do my best to use the right account to hold each security, such that I minimise tax outflow, but you can only do so much of it, given that some accounts (like Pension in UK) is limited in contribution each year.