
An analysis of free cash flows
Cash flows are life blood of a company

Free Cash Flow (FCF) is like oxygen for a corporation. Just as oxygen sustains life by providing the necessary energy for vital functions, FCF fuels a company's growth and stability.
FCF represents the surplus cash generated from operations, acting as a lifeline for reinvestment, debt repayment, and shareholder returns. Similar to how a human needs a constant supply of oxygen to thrive, a company requires a positive cash balance to support its ongoing operations, fund strategic initiatives, and navigate unforeseen challenges, and the said cash balance is maintained by running a business with a positive FCF.

Without a healthy FCF, either the company will struggle to survive, or will have to convince funding sources (through debt, secondary equity placements or other funding methods) to provide them with cash to continue its operations.
When thinking about FCF, two things are important to note.
1. FCF != Profits
In modern accounting profits are calculated on accrual accounting, and through multiple scenarios, companies can have profits that are greater than free cash flows. Scenarios are outlined in footnote 1.

While analysing a company it is important to note whether their profits are loosely correlated with their free cash flows over medium to long term. It is understandable, and indeed desirable, that cashflows will differ from profits temporarily, but over long term they should converge. The best companies will improve their FCF at a rate better than their profits.
2. FCF is not a standard accounting construct
Cash flows are standard accounting construct and can be found in every annual report of a company. However, Free Cash Flow is not a standard accounting construct, but instead is a financial metric used outside the scope of statutory accounting principles. Loosely, FCF is calculated by subtracting the capital expenditures (CAPEX) from the operating cash flow (OCF). However, what is considered Capex can be construed differently depending on how a reader looks at it. Because of this, FCF’s calculation can differ from one person to another (and from one website to another) depending on what is included and what is not.
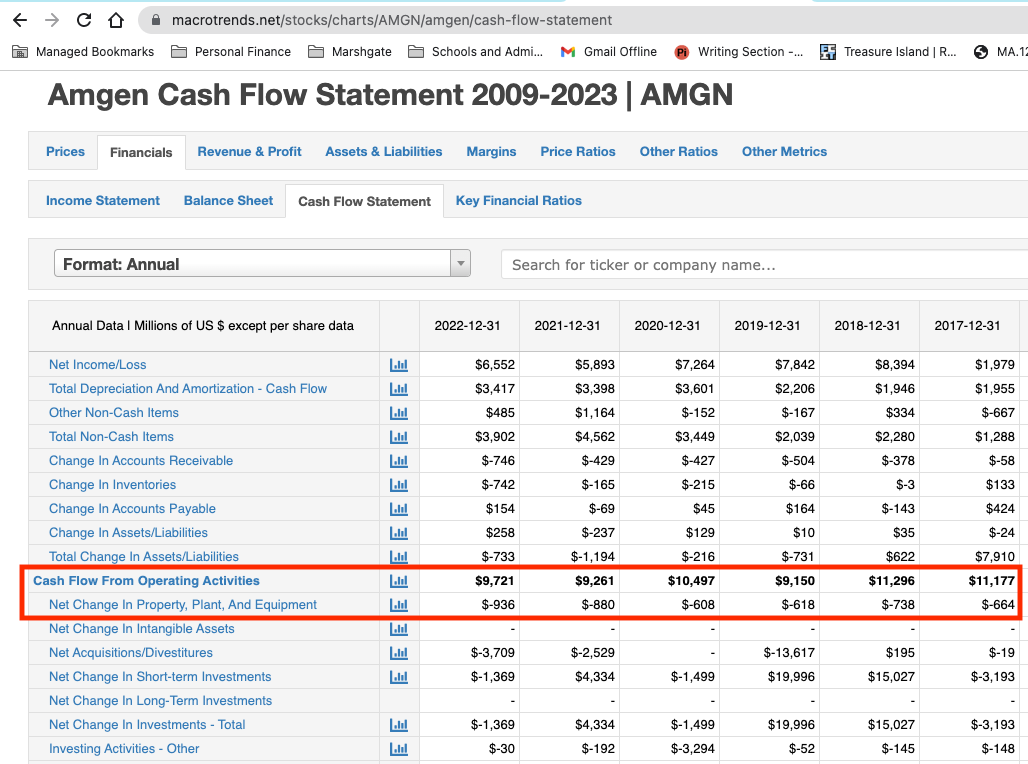
Broadly, it is considered an acceptable practice to calculate FCF as Operating Cash Flow (OCF) - net changes in Property Plant and Equipment (PPE). In the GAAP world (followed by all US companies and many companies abroad), net changes in PPE are called out explicitly, making it easy to compute FCF by this method.
In other accounting standards, like IFRS, it is not necessarily to do so explicitly and many companies will break it down. So the analyst will need to apply their discretion to calculate this correctly. In the below case, I am leaving out “purchase of investments” as I don’t know whether they are capital expenditures or not.
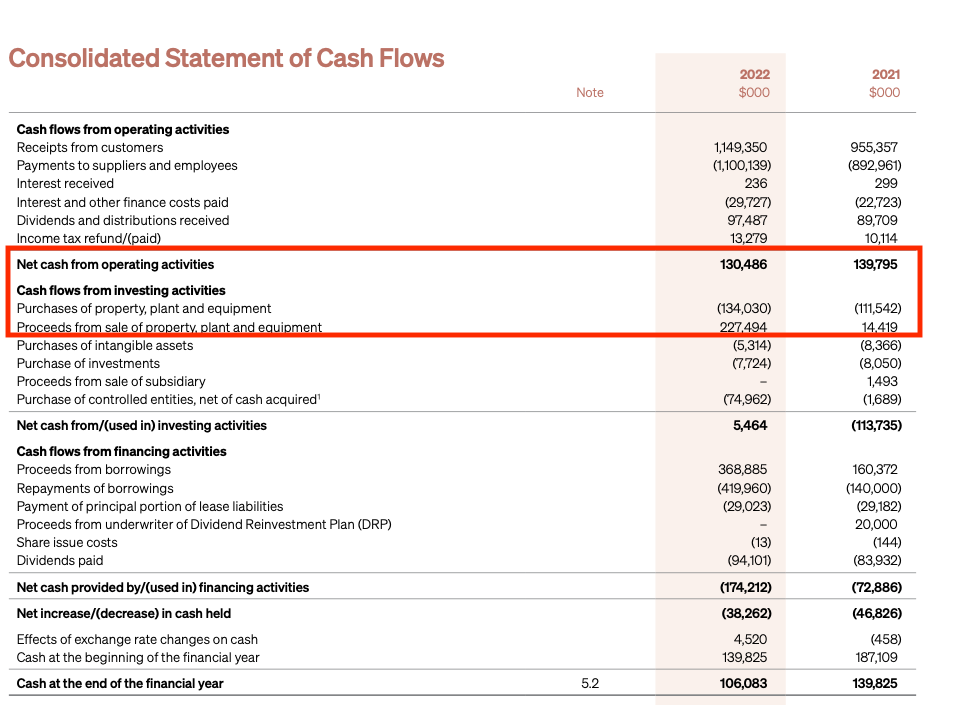
I have just concluded the process of filling up FCF records for all the companies in my Coffee Can Portfolio. When GAAP metrics were available I used it. When not, I have mostly used OCF - PPE Expenses, which means I am explicitly ignoring any proceeds from sales of PPE. In most cases, sale of PPE was so minimal that it was okay to ignore this, but in cases like Brickworks (above), I chose to include them in, as it was material in many years. In the end, what I wanted to find out was the rate of change of this metric, not the absolute numbers themselves.
Findings
All findings are based on data from 2009 to date, that’s between 13-14 years of data, depending on their year end.
Companies with outstanding FCF growth
The following companies have been generating long term (10-14 years) FCF per share growth of greater than 20% per annum (in descending order of FCF/share growth):
Visa (NYSE:V)
Bunzl (LON:BNZL)
JD.com Inc (HKG:9618)
Alibaba (HKG: 9988)
Sinopharma Group (HKG:1099)
NetEase Inc (HKG:9999)
Tencent Holdings (HKG:0700)
Mastercard (NYSE:MA)
Companies with FCF/share growth > Earnings/share growth
Furthermore, the following companies have grown their FCF per share at a rate greater than their earnings per share, showing superior cash flow management (in alphabetic order of the ticker):
Iress Ltd (ASX:IRE)
Enagas SA (BME:ENG)
Red Electrica Corporacion SA (BME:RED)
UCB SA (EBR:UCB)
Anhui Conch Cement Ord Shs H (HKG:0914)
Sinopharm Group Co Ltd (HKG:1099)
JD.com Inc (HKG:9618)
NetEase Inc (HKG:9999)
BAE Systems plc (LON:BA)
Bunzl plc (LON:BNZL)
Legal & General Group Plc (LON:LGEN)
MONDELEZ INTERNATIONAL INC Common Stock (NASDAQ:MDLZ)
Microsoft Corp (NASDAQ:MSFT)
Petmed Express Inc (NASDAQ:PETS)
Mastercard Inc (NYSE:MA)
Visa Inc (NYSE:V)
Roche Holding AG Genussscheine (SWX:ROG)
Open Text Corp (TSE:OTEX)
Stella-Jones Inc (TSE:SJ)
Every company from the first list, except Alibaba and Tencent Holdings have made it to the second list too. This is not a co-incidence - this indicates that the business is very good at generating cashflow and needs little of it to be invested back in terms of capital expenditure to generate future incomes.
I am thrilled about the FCF returns of all of the above 21 companies.
Companies with Poor FCF/share growth:
The following companies have either decreased their FCF in the past 10-14 years, or their recent FCFs are negative:
Challenger Financial (ASXC:CGF)
Disney (NYSE:DIS)
Reliance Industries (LON:RIGD, NSE:RELIANCE)
State Bank of India (LON:SBID, NSE:SBIN)
The other 23 companies have middling results on FCF. Nothing great to write home about. Nothing too scary either.
Consistency of Cash Flows
Outside of the growth of cashflows over time, investors must also care about the consistencies of cashflow. Specifically some 30 companies in the portfolio are able to generate positive cash flows without fail. Another 15 did so 2/3rds of the years in consideration. Only a handful (Challenger Financial, Lenovo and Reliance) failed to achieve the 2/3rds consistency check.
I also look for which companies are able to grow their free cash flow year on year consistently. Only one company - Alibaba - has a spotless track record. 33 other companies have a record of increasing their FCF half of the years under consideration.
Summary
FCF is a very useful metric to understand how a company is performing, specially when FCF track record is looked at over long periods of time. Most companies in my coffee can portfolio have generally decent track records of FCF generation as well as FCF growth. I will look to incorporate this data into my scoring and weighting framework to support my future decision making.
Some scenarios
Think of non-cash expenses (depreciation & amortization) that don’t have any cash flow associated but improves the profit outlook. Investments in capital expenditure are only reflected on the P&L to the extent of the depreciation in that year, but payment is likely to have been made in full.
Effects of working capital (accounts receivable, accounts payable & inventory) can alter your profit outlook and will likely detach it from cash flows
Financing activities can increase cashflow (when new debt or equity is issued) or reduce cashflow (when debt is repaid or shares are bought back), but won’t reflect in the P&L.