
A quick look at UK Property - 2023 fall edition
Market is moderating, but affordability is at 15 year low

I have so far attempted to focus on writing solely on equity investments on this blog, partially because that’s what I spend the majority of my time and energy, and invest my money primarily on. That shouldn’t preclude me from occasionally throwing out some views on other things like residential real estate. So here I go.
In my previous blog location, I have written about UK property market in the past, which might be useful reading, but is not a pre-req:
https://www.shreeni.info/2021/03/affordability-of-homes-in-uk-1990-vs.html [2021]
https://www.shreeni.info/2021/04/follow-up-to-post-of-affordability-of.html [2021]
https://www.shreeni.info/2022/07/effect-of-interest-rates-on-real-estate.html [2022]

For context, real estate has been one of the best investment classes in the UK and elsewhere in the past 2 decades or so. In the UK, residential property has gone up roughly 3.4x since the turn of the century, adding some 5.4% on an annualised basis. Past decade and half also coincided with incredibly low interest rates, which means on a leveraged basis investors got to often enjoy 10-12% returns per year or higher on their meagre outlay of deposits. However, the first serious increase in interest rates of this century was going to pose problems, which is when I last posted on this topic. This post is going to review numbers from there on.
In general, I have used a few data points to look at where real estate market is. Specifically, what I am interested is - how are prices of houses moving with relation to wages, because affordability is largely dependent on how much we earn (along with interest rates), which effects how much we can save for a deposit and how much we can pay each month in mortgages & rents1.
")
(pre-script: Individual circumstances will wildly vary - your income growth, your mortgages, your rents will depend on what industry you work in, how you have progressed in your income generation, your choice of locations, when you chose to enter either ownership or a tenancy lease and how long did you fix your mortgage/tenancy. Since I can’t review those, I am sticking by macro trends. If your experiences materially differ, you know why and if it does, I hope it is on the positive side.)
So, where are we today?
When I last wrote, in July 2022, the median house in the UK was trading at £288,156, while median wage was £31,789. This means that houses were trading at 9.01x wages.
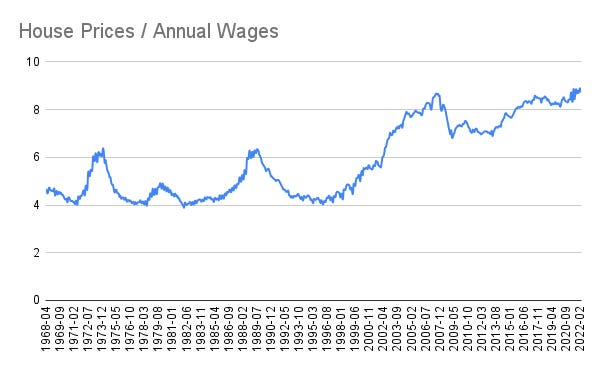
I also commented that since the turn of the century the range for Price/Wages had moved to the 7x-9x range due to ubiquitousness of of 2-income households. However, 9.01x as I noted then was almost at the highest end of that range. I could not have called the top at a better time. That ratio stayed above 9x for precisely two more months, reaching a peak of 9.028 in September of 2022, and then has been slowly inching downwards.
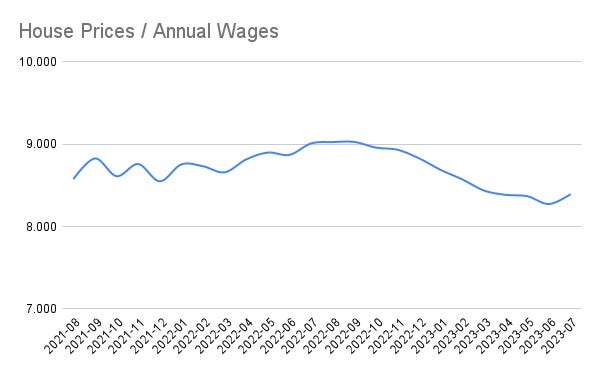
Here is the same graph, updated with just data from the past 24 months. As it stands in July 2023 (latest month with complete data at the time of writing), this ratio stands at 8.394x. Just to complete our information, the absolute median house price peaked at £292,187 in November 2022 and has since moderated to £289,824 as of July 2023.
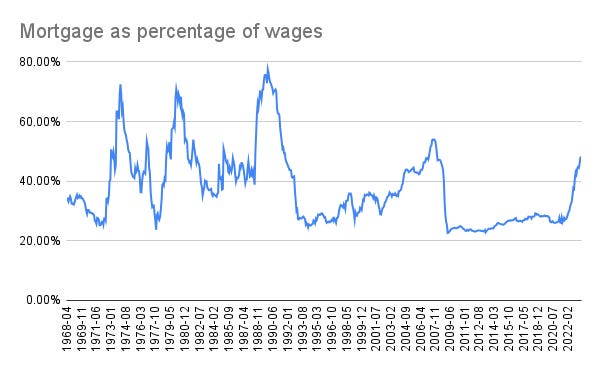
This however, is not much consolation. The affordability of housing remains tough. For instance while the deposit needed to secure a loan has inched down from 1.81x annual wages to 1.68x annual wages. However, mortgages have gone up from 35.38% of monthly wages to 48.31% of monthly wages now. This is largely due to the increase in interest rates over the past year or so.
This means that even compared to what was a historic high in prices, and the moderation since, economics of home ownership is at still detrimental on real basis. The last time we paid 48% of our monthly wages in mortgage was in 2008-Jan, right around the time the GFC bubble burst.
The worst part is that the effect of this affordability decrease hasn’t percolated through out the economy. As more homeowners (like yours truly) have to remortgage their fixed rates in the next 6-24 months, the higher interest rates will slowly trickle through more and more households, making holding on to our homes dearer and dearer. Given the lack of long term fixed rates in the UK, home ownership affordability is a bit of a moving metric, making it tougher to estimate the life time cost of holding on to property.
Mortgages vs Rents
The natural next question is - haven’t rents increased too? Rents have also increased. ONS data on rent tells us that rents have increased some 20-23% over the past 8 years depending on where you live, but that is overshadowed by wage increases, which have increased from £24,769 to £34,476 in recent data, some 40% during the same period. In fact the net effect of putting rents and mortgages, both indexed to wages, is rather stark:
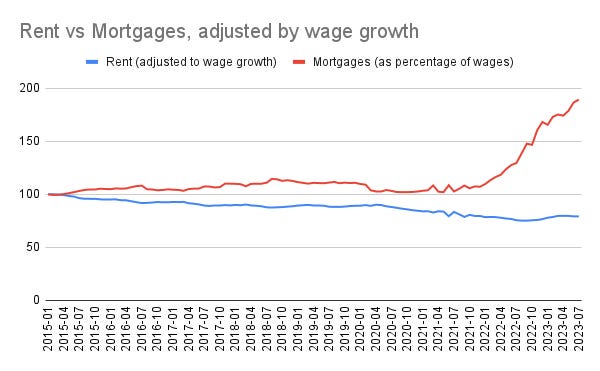
In effect, home owners, both landlords and occupier-owners are bearing the brunt of the interest rate increases, much more than renters themselves are. Now, those who are renting are likely to find the last statement deeply offending, but at the macro level the numbers are what they are.
Uncertain future
So, by all measure, property prices are still elevated. How elevated are they? If we were to say that price-to-annual-wages should go back to say the middle of the 7x-9x range, then we are talking about another 4% drop before it reaches 8x. If we were to reach the bottom of that range, we are talking a 16% drop in prices relative to wages. If we go by mortgage as a percentage of our monthly income, the long term average is 32%, and we are at 48% today. We will need to see a drop of about a third before it hits sweet spot on that metric. Of course, last metric can also be influenced by interest rates - so an interest rate drop of ~3% will probably get us closer to that long term mid-point.
In summary, we find ourselves in a weird market, where prices have moderated and yet seem to have ~4%-33% further downside before it reaches long-running valuation bands. Will things go there? I don’t know.
Given how much this country cares about its property valuations, my suspicion is that Government will enter and incentivise demand far before it slides down 33%. We have precedence of that - during Covid, stamp duty holidays were announced to sweeten demand for property. Governments also want to encourage home ownership and keeps enacting policy to that effect (help to buy, if you remember). In effect, price-discovery of the true bottom of the market is likely to be impeded by Government intervention(s), something we can’t predict as yet.
Summary
What does this mean for individuals like us? Buying a property for home ownership is a deeply personal experience and has more consequences to our life than just economic rationale. From that perspective, if you are a buyer (or a seller for that matter), you should do what works best for you.
In any case your personal circumstances can be significantly different than the macro state of affairs discussed in this post - for instance, if you just got a big bonus that pushes your deposit further, and you have been meaning to buy for a long time, waiting for a 4% downside might be meaningless.
That said, if property is being purchased purely as an investment - i.e to let it out, then perhaps these valuations might be meaningful in swaying your decision one way or the other.
What do you think?
I know I am excluding cash buyers in this calculation and they are a fairly big lot - between a quarter and a third. I am reluctantly comfortable with excluding them in this analysis, because (a) I think price-setting is still happening through mortgage buyers as they form the super majority and (b) thinking of prices in isolation is harder as a thought exercise and easier when anchored to something else - like wages.
Great Article!